www.enhencer.com
Turn Data to Profit in Minutes
Predict customer's behavior with the most practical Automated Machine Learning platform.

www.enhencer.com/churn-prediction
Churn Prediction
Focus only on 5% of your customers who are 90% likely to leave.Know who they are and how they behave.Take the right actions to the right customers at the right time by decreasing your marketing costs.

www.enhencer.com/purchase-propensity
Predict Purchase Propensity
Increase the positive return of such campaigns up to 90% and learn why and how the marketing campaigns are made effective against which customer group.

Wednesday, December 28, 2016

Advanced MRO Planning and Scheduling Webinar

ICRON Technologies, a leading developer of Advanced Planning and Scheduling solutions since 1992, has been in Aerospace MRO (Maintenance, Repair and Overhaul) optimization for more than a decade and shares its experience in this area in this webinar below.

In this webinar, you will discover how a next generation MRO planning and scheduling solution can improve your MRO activities and KPIs such as TRT times, overtime and productivity.

See below for a detailed description of the topic :


Modern facilities are text book cases of complex production environments :
  • 100% Make-to-order
  • Capital-intensive production processes
  • High product mix, large number of components or production tasks
  • frequent schedule changes
Planning and scheduling of thousands or tens of thousands of repair operations w.r.t tight physical resources, regulations, certifications, spare parts, etc. in this environment is a very difficult job. Frequent rescheduling due to post strip/inspection repair needs, unplanned Aircraft On Ground (AOG) repairs and part cannibalization, machine breakdowns, spare part unavailability's, certified personnel absence, etc. also makes planning more complex. More over, MRO plan, shop floor execution data and ERP data are not blended and visualized so the shop floor is a black box so the environment is pretty much a black box.

Current ERP systems also do not help a lot when it comes to planning and scheduling. Most ERPs in MRO are originally developed for mass production, old fashion manufacturing. They assume capacity problems are solved in advance and they plan as if the environment has infinite capacity.

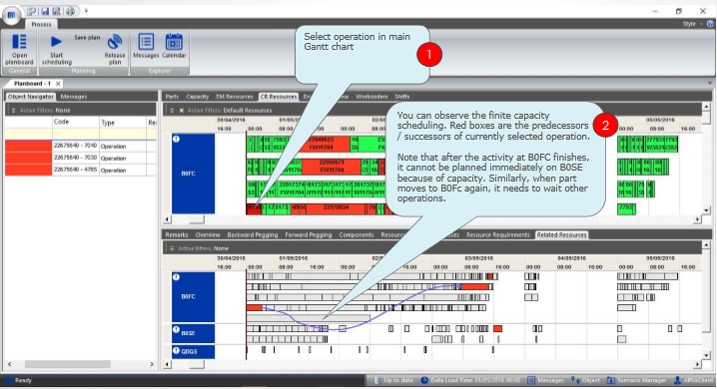
One of ICRON's biggest feature is Finite Capacity Planning and Optimization. Better planning and sequencing w.r.t all your constraints will produce better and more realistic results. With finite capacity planning, ICRON ensures that you know any bottle neck and lateness due to these bottlenecks so you can take action.

Finite Capacity Planning and Optimization


About ICRON Technologies

Thursday, March 31, 2016

Tableau has acquired HyPer high performance database system

Tableau has announced the acquisition of HyPer, in-memory, high performance database system designed for simultaneous, high performance OLTP and OLAP processing.

Hyper high-performance database system will be integrated into Tableau’s product offerings and bring a host of new capabilities to Tableau customers such as faster analysis of large data sizes, richer analytics, enhanced data integration and data transformation as well as support for semi-structured and unstructured data.

Tableau is highly optimized and works quite fast in many applications but in applications where you need to read large volumes of data, like hundreds of millions or billions of rows, it can get dramatically slow (yes there are some illustrations of Tableau with large datasets but they are very isolated, single report demos and in a real life dashboard things can get pretty slow if you need to reaf more than 100 million rows). There are some other tools also available in the market with native Tableau data connections. Most notable and famous of these is EXASOL in-memory analytic database management software.

Like Tableau, HyPer grew out of a research project. started in 2010 by professors Dr. Thomas Neumann and Dr. Alfons Kemper, chair of at the Technical University of Munich (TUM) Database Group. Four of the project’s Ph.D. students, Tobias Muehlbauer, Wolf Roediger, Viktor Leis and Jan Finis, will join the Tableau family, focused on integrating Hyper into Tableau products.[1]

Here is a detailed definition of Tableau's new HyPer in the project website :

"HyPer is a main-memory-based relational DBMS for mixed OLTP and OLAP workloads. It is a so-called all-in-one New-SQL database system that entirely deviates from classical disk-based DBMS architectures by introducing many innovative ideas including machine code generation for data-centric query processing and multi-version concurrency control, leading to exceptional performance. HyPer’s OLTP throughput is comparable or superior to dedicated transaction processing systems and its OLAP performance matches the best query processing engines — however, HyPer achieves this OLTP and OLAP performance simultaneously on the same database state. Current research focuses on extending HyPer’s functionality beyond OLTP and OLAP processing to exploratory workflows that are deeply integrated into the database kernel by utilizing HyPer’s pioneering compilation infrastructure."[2]

Tableau HyPer high performance database system


[1] - Welcome, Hyper team, to the Tableau community!
[2] - http://hyper-db.com/

Tuesday, December 22, 2015

Self-service Business Intelligence for Commercial Property Leasing

Commercial Real Estate Leasing is an extremely competitive sector of the Real Estate Industry and the players are required to be imaginative and have information at their fingertips to avail of the opportunities that arise as well as quickly respond to government, economic and market pressures that might challenge their business models. Having market and business metrics at the tips of your fingers therefore becomes a necessity.

Interactive Business Intelligence gives Commercial Real-estate professionals number of benefits:

  • Allows you to have a data based strategy for real estate portfolio optimization.
  • Provides a broad spectrum of self-service, easy to use business intelligence tools with customizable levels of access,
  • reporting or analytics per user.
  • Allows for both internal and external performance measurement and benchmarking.
  • Interactive BI breaks down multidimensional Data mashups with beautiful, rich data visualizations that support your
  • natural ability to spot patterns.

Self-service Business Intelligence for Commercial Property Leasing

Download the white paper here for a step-by-step introduction to Self-service Business Intelligence for Commercial Property Leasing.

Click2Analyze Sales Performance Analysis Dashboard

Your ability to track, analyze, and understand all aspects of your sales – what is being sold to which customer, when and by whom – is critical to identifying profitable customers. It is also important to keep track of your company's and sales people's sales performance to keep the company sales at top.

KMS Click2Analyze Sales Performance Analysis dashboard is compatible with any ERP system enabling companies to analyze their sales performance, giving you the full range of analysis, from the dashboard to the individual transaction.

Now with Click2Analyze Sales Analysis dashboard, you have complete visibility to business-critical customer, sales, product, budget, and channel data in a single, powerful yet easy-to-use business performancemanagement application.

Click2Analyze Sales Performance Analysis Dashboard can easily be integrated with your enterprise systems, even for companies running different ERP and CRM systems in differentdivisions. The dashboard provides a rapid ROI due to its rapid deployment and ease-of-use.

Sample Analysis
  • What is my market share per country and product?
  • What are my target sales and how are my current sales against these target values?
  • How many customers were acquired, retained or lost in the present month, quarter or year?
  • What are my lost sales due to lost customers? 
  • What is the frequency of purchase of my active customers?
  • Who are my high selling and highly profitable or low selling but highly profitable customers?
KMS Sales Performance Analysis Dashboard
The KMS Sales Analysis dashboard is being used by more than 100 companies is Asia Pacific to drive growth and boost sales.

The package consists of:
  • KMS Click2Analyze Sales dashboard
    • Executive dashboard
    • Sales Analysis dashboard
    • Customer Statistics dashboard
    • Portfolio Analysis dashboard
    • What-if Analysis dashboard
    • Detailed Report dashboard
    • KPI dashboard
  • Software licenses for 5 named users
  • One year of maintenance
  • User training
You can find more details here : KMS Click2Analyze Sales Dashboard Product Page

Thursday, December 10, 2015

Overcoming Oracle Essbase challenges with Jedox Webinar

It's video week at Jedox! This recorded webinar addresses Hyperion Essbase users and reviews key issues faced by business users and developers of legacy calculation engines and planning systems. Learn how the modern Jedox platform can address these challenges to provide greater user satisfaction, less IT burden, and a rapid Return on Investment.

Organizations that simplify and optimize planning, forecasting and reporting free up valuable resources, so they can focus on growth. However, many organizations feel stuck with slow platforms that are not user-friendly, expensive to maintain, and difficult to upgrade.

Often users were forced to select a tool like SAP Business Planning and Consolidation (BPC), or Oracle because it came with their ERP, rather than by selecting the most suitable tool from the market. Other tools like Hyperion Essbase and Hyperion Planning had some unique features 20 years ago, but have been overtaken by newer and more modern platforms that combine planning with visualizations and analytics.


Jedox is built on Excel, the world’s most used reporting and planning tool. Jedox is designed to enable you to leverage your Excel skills to transform your reporting, budgeting and analysis. Easy to use so you can focus on business outcomes.

Jedox software creates extremely effective budgeting and planning and Corporate Performance Management solutions for systematic data analysis.

Its core is a cell-oriented, multi-dimensional in-memory OLAP server that has been especially designed for planning, analysis, reporting, and data consolidation.

Wednesday, December 9, 2015

QlikView 12 Released

Qlik has finally released the new version of its business intelligence platform, QlikView 12. The major change in the QlikView 12 compared to QlikView 11 (which was released in 2011) is the data engine. QlikView now uses the same QIX Associative Data Indexing Engine (QIX) that powers Qlik Sense.

Other than the data engine improvement, QlikView also has enhancements in its security and mobile experience. All functions on web client are now available on touch devices without limitations.  Other changes are improved clustering, native connectors to web services and accessibility of Data Market to QlikView.

Qlik has released a new platform, Qlik Sense, in September 2014, after two years without any major release and the release date of QlikView 12 was since awaited by existing users of the platform.

The last major release of QlikView was QlikView 11 released in 2011. Since the company was releasing a new version in every year the expectation was that Qlik (then called QlikTech) would release QlikView 12 in 2012. But QlikView 12 has not been been released or talked about until late 2015.

In early 2013, Qlik started to talk about a new platform called QlikView.Next. It was expected to be the next QlikView but Qlik released the desktop edition of the product in 2014 and renamed it to Qlik Sense.

QlikView.Next is renamed as Qlik Sense because it is not the next version of QlikView. It is a new business intelligence platform. Its data loading and cleansing engine and expression engine seems to be same as QlikView but front end is entirely different:

QlikView is a tool for situations where you want prepared business applications, i.e. applications created by developers who put a lot of thought into the data model, the layout, the charts and the formulae; and deliver the applications to end-users who consume the applications. We call this Guided Analytics. The end-user has total freedom to explore data, select, drill down and navigate in the information, and can this way discover both questions and answers in the data. The end-user is however limited when it comes to creating new visualizations. This type of situation will without doubt be common for many, many years to come. 
Qlik Sense is a tool for situations where you don’t want to pre-can so much. Instead you want the user to have the freedom to create a layout of his own and in it, new visualizations; charts that the developer couldn’t imagine that the user wants to see. You want Self-service data discovery, which means a much more active, modern, engaged user. In addition, Qlik Sense is much easier to use when you have a touch screen, and is adaptive to different screen sizes and form factors. On the whole, Qlik Sense is a much more modern tool.
Source : QlikView and Qlik Sense

Qlik Sense is not QlikView 12
Qlik Sense is not QlikView 12. In fact, Qlik Sense is not QlikView at all.

My estimation was that they would release a new QlikView version named QlikView 12. And  I was hopefully this new server will support both QlikView and Qlik Sense as front end. For example Access Point of QlikView 12 would display both QlikSense and QlikView applications. I wrote since both Qlik Sense and QlikView have common expression and data engine, it should not be difficult". It seems like this feature is not on the roadmap at all.

Monday, November 30, 2015

Data Visualization by Tableau Introduction in Singapore

If you are looking for a chance to know Tableau data visualization platform in Singapore, Knowledge Management Solutions, a Business Intelligence and Data Visualization solution provider and Tableau partner in Singapore, is offering a half day free Introduction to Data Visualization with Tableau 9

Tableau is a business intelligence and data visualization software platform that allows anyone to connect to data in a few clicks, then visualize and create interactive, shareable dashboards with a few more. It’s easy enough that any Excel user can learn it, but powerful enough to satisfy even the most complex analytical problems. Securely sharing your findings with others only takes seconds. The result is BI software that you can trust to actually deliver answers to the people that need them.

Tableau Singapore event - Introduction to Tableau 9.0
Data Visualization with Tableau in Singapore
Who should attend?
Business people, General Managers, Analysts, Operations Managers, IT Managers, HR Managers, Finance Managers, Marketing Managers, Sales Managers, Service Managers, etc.

What you will learn during the event:
You will witness the self-service Business Intelligence capabilities of Tableau platform as well as different components of the platform.

Seats are limited hence we encourage you to register early to secure your seat(s).

Tableau Event Details
Date : 10th December 2015
Time: 09 am to 12 pm
Venue: South Beach Tower, Level 10, 38 Beach Road, Singapore 189767 (Tableau Software APAC Office)

Agenda:
1.     Introduction to Tableau Business Intelligence and Data Visualization
2.     What is new in Tableau 9
3.     Data extraction from different sources
4.     Data modeling
5.     Building your data visualizations in Tableau
6.     Dashboards and stories

See the details here.