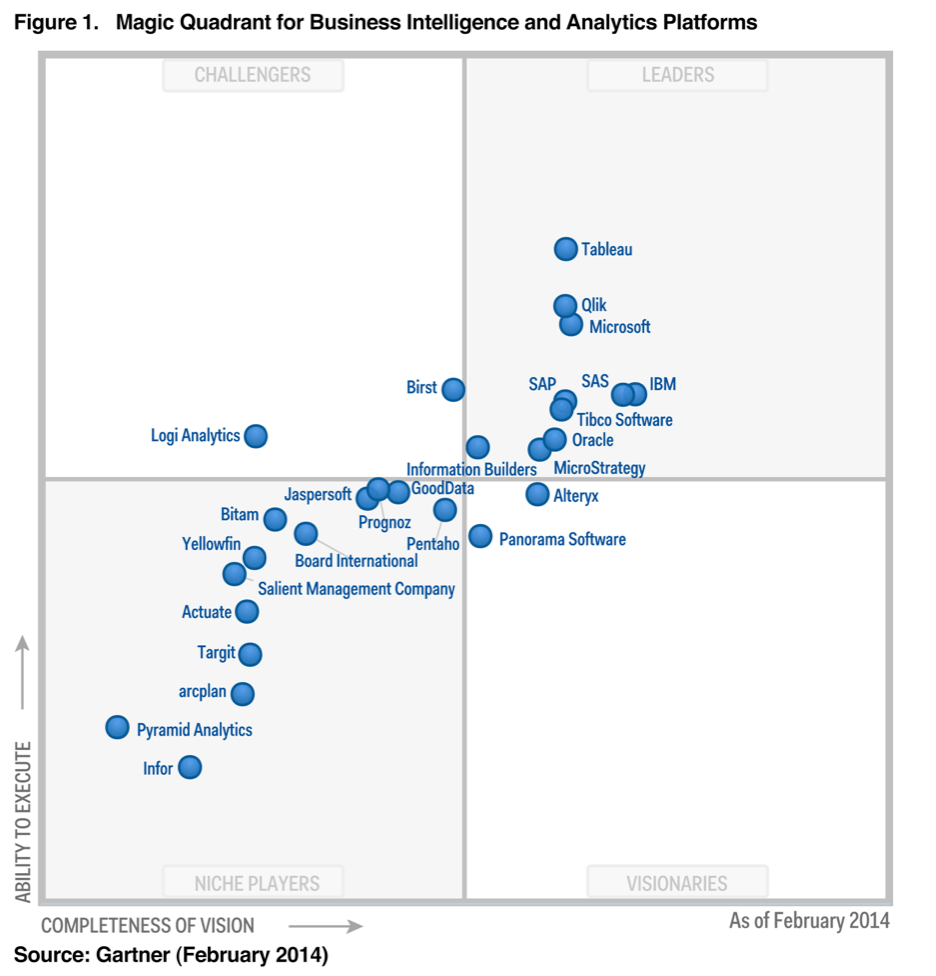
American information technology research and advisory firm Gartner’s Magic Quadrant for Business Intelligence and Analytics Platforms is a highly respected ranking of Business Intelligence and Analytics players. In Magic Quadrant for Business Intelligence and Analytics Platforms 2014 (you can access full report from here), the leaders quadrant, which houses top players in terms of ability to execute and completeness of vision, is now crowded with Tableau, Qlik (QlikTech which has re-branded itself), Microsoft, SAP, SAS, IBM, Tibco Sportfire, Oracle, Information Builders and Microstrategy.
Tableau, which has entered the leaders quadrant just in 2013, is now the best BI/BA platform in terms of ability to execute, clearly highest scoring leader in terms of ability to execute.
There are two challengers in 2014, Birst and Logi Analytics (formerly LogiXML). Although Logi Analytics seem to go down in both ability to execute and completeness of vision, Birst is now almost in the leader’s quadrant.
Each year, Gartner analyzes every vendor in the Business Intelligence and Analytics market. Their research has particular significance because it often identifies the innovations that drive the market. As part of that report, Gartner also releases the Magic Quadrant, which shows the relative positions of the market’s competitors. The trends and innovations that Gartner has identified this year are familiar ones.
 |
| Gartner Magic Quadrant for Business Intelligence and Analytics Platforms 2014 |
Tableau’s popularity is reflected in its Wall Street highflyer profile. Tableau’s year-over-year revenue growth has spiraled upward 62%, 71%, 90% and 95% in the last four quarters.
Here is a summary of what happens in Business Intelligence platform domain based on Gartner’s report:
The broad shift to the left is tied to the years-long ascendance of data-discovery platforms from the likes of Tableau Software, QlikTech, and Tibco Spotfire. Data discovery is now driving the majority of new software license revenue, but these platforms tend to lack “the necessary features in relation to governance, administration, and scalability,” Gartner reports.
Meanwhile, incumbents like IBM, SAP, Oracle, and MicroStrategy that tend to do well on governance, administration, and scalability have had “limited success in delivering ‘good enough’ data discovery capabilities,” Gartner writes. In other words, practitioners want and need the ease and speed of data-discovery platforms, but they shouldn’t have to give up admin control and the assurance of data-modeling and data-quality consistency across high-scale deployments.
Source : Gartner BI Magic Quadrant: Winners & Losers
