www.enhencer.com
Turn Data to Profit in Minutes
Predict customer's behavior with the most practical Automated Machine Learning platform.

www.enhencer.com/churn-prediction
Churn Prediction
Focus only on 5% of your customers who are 90% likely to leave.Know who they are and how they behave.Take the right actions to the right customers at the right time by decreasing your marketing costs.

www.enhencer.com/purchase-propensity
Predict Purchase Propensity
Increase the positive return of such campaigns up to 90% and learn why and how the marketing campaigns are made effective against which customer group.

Monday, February 24, 2014

Magic Quadrant for Business Intelligence and Analytics Platforms 2014

American information technology research and advisory firm Gartner’s Magic Quadrant for Business Intelligence and Analytics Platforms is a highly respected ranking of Business Intelligence and Analytics players. In Magic Quadrant for Business Intelligence and Analytics Platforms 2014 (you can access full report from here), the leaders quadrant, which houses top players in terms of ability to execute and completeness of vision, is now crowded with Tableau, Qlik (QlikTech which has re-branded itself), Microsoft, SAP, SAS, IBM, Tibco Sportfire, Oracle, Information Builders and Microstrategy.

Tableau, which has entered the leaders quadrant just in 2013, is now the best BI/BA platform in terms of ability to execute, clearly highest scoring leader in terms of ability to execute.

There are two challengers in 2014, Birst and Logi Analytics (formerly LogiXML). Although Logi Analytics seem to go down in both ability to execute and completeness of vision, Birst is now almost in the leader’s quadrant.

Each year, Gartner analyzes every vendor in the Business Intelligence and Analytics market. Their research has particular significance because it often identifies the innovations that drive the market. As part of that report, Gartner also releases the Magic Quadrant, which shows the relative positions of the market’s competitors. The trends and innovations that Gartner has identified this year are familiar ones.
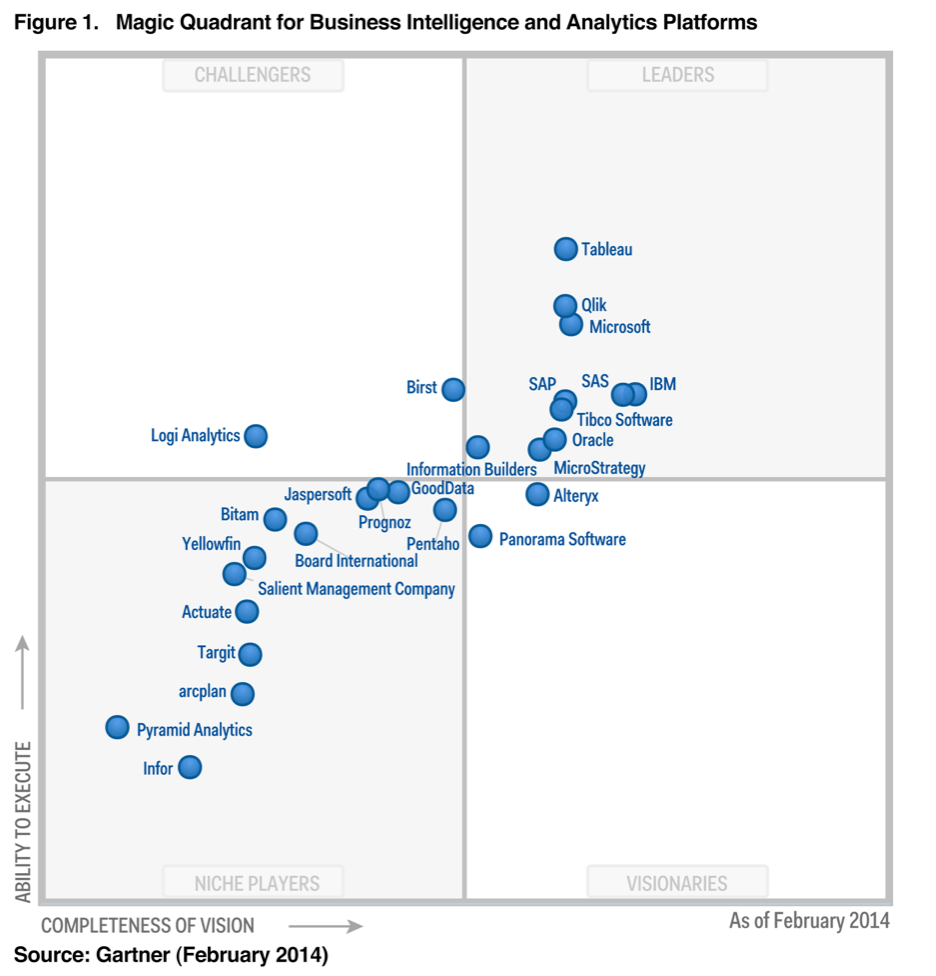
Gartner Magic Quadrant for Business Intelligence and Analytics Platforms 2014
Tableau’s popularity is reflected in its Wall Street highflyer profile. Tableau’s year-over-year revenue growth has spiraled upward 62%, 71%, 90% and 95% in the last four quarters.

Here is a summary of what happens in Business Intelligence platform domain based on Gartner’s report:

The broad shift to the left is tied to the years-long ascendance of data-discovery platforms from the likes of Tableau Software, QlikTech, and Tibco Spotfire. Data discovery is now driving the majority of new software license revenue, but these platforms tend to lack “the necessary features in relation to governance, administration, and scalability,” Gartner reports. 
Meanwhile, incumbents like IBM, SAP, Oracle, and MicroStrategy that tend to do well on governance, administration, and scalability have had “limited success in delivering ‘good enough’ data discovery capabilities,” Gartner writes. In other words, practitioners want and need the ease and speed of data-discovery platforms, but they shouldn’t have to give up admin control and the assurance of data-modeling and data-quality consistency across high-scale deployments.
Source : Gartner BI Magic Quadrant: Winners & Losers

Saturday, February 8, 2014

Business users interested in more complex problems of Business Analytics

Business users are interested in more complex problems in the domain of Business Analytics and Business Intelligence according to survey compiled in large meetups targeting business analysts and business intelligence users. Among 5,000 participants almost half are interested in big data and data analytics. Interest in data visualization popularized by Qlikview and Tableau is 29%. 2 more sophisticated Business Analytics topics, data mining (25%) and predictive analytics (23%) are also in the top 10.

You can read more here at Business Analysts Want Access To Advanced Analytics.


Monday, February 3, 2014

Sales Management and Customer Analysis Demo

The Sales Management and Customer Analysis is a popular domain where Business Intelligence and Analytics is applied. In this demo for sales managers and individual reps, a high level dashboard, product, region, and customer focused analyses, and of course a full set of transaction level detail is covered. It also features a nice demonstration of QlikView 11 Comparative Analysis - allowing reps to identify target customers that have purchased certain sets of products but have not purchased other sets.

You can see the demo video below. If you want to play around with it on your own here is the link to download self-executive Business Analytics application as well as Overview documentation. The package also includes a link to web based version of this demo which can be accessed by mobile devices.

Sunday, February 2, 2014

Manufacturing analytics demo video

This manufacturing analytics demonstration is a Plant Operations application, enabling the analysis of the performance of a Wrapping paper plant and it's production process. It is possible to analyse overall production performance and individual machine performance across a number of key dimensions such as Division, Branch, Time etc.

 It gives you the ability to analyse various metrics important to the efficient running of a plant/production line.

  •     Scrap
  •     Plant Costs (including labour, material and overheads)
  •     Machine efficiency and production stats
  •     Work order cycle time
You can watch the video below. If you want hands on the application, access the self-executable application and link to web based version of the dashboard by clicking here : Plant Operations Demo Package.


The demo runs on powerful QlikView Business Discovery platform which bridges the gap between traditional BI solutions and standalone office productivity applications, enabling users to forge new paths and make new discoveries. It brings a whole new level of analysis, insight, and value to existing data stores with user interfaces that are clean, simple, and straightforward. 

Wednesday, January 29, 2014

Reporting vs. Analysis and QlikView

This post is moved to Reporting vs. Analysis and QlikView post in Business Intelligence and Beyond blog.


Reporting vs. Analysis
Reporting versus Analytics
Photo : Adobe Digital Marketing Blog

Wednesday, January 22, 2014

QlikView and Salesforce Seminar in Singapore on 25th April 2014

Business Intelligence technologies are a must-have in every business to make informed decisions and keep up-to speed with the ever-evolving markets. QlikView’s disruptive technology makes it a key player and leader in the industry; with its flexibility and powerful analytics environment, building QlikView apps can be mastered by both, business users as well as developers.

QlikView is a great platform to develop business analytics application to provide Salesforce users with key-pipeline related data at their fingertips. A QlikView Salesforce Analytics application allows you to easily load and analyze all your CRM information directly from your salesforce.com account. With QlikView for Salesforce, information can be explored intuitively and visually – with drill-down detail in just a few clicks.

If you are in Singapore and a Salesforce user, do not miss this seminar on QlikView and Salesforce by Knowledge Management Solutions (KMS). KMS will perform a demo presentation which will cover the following topics:

- Drive higher levels of sales efficiency and effectiveness
- Measure pipeline trends across the entire sales cycle
- Analyze customers and prospects across multiple dimensions and data sources
- Plan and track more effective marketing campaigns and linked sales activities
- Increase demand generation, cross-sell and up-sell opportunities

Sample QlikView Salesforce Analytics Dashboard

Date: 25th April 2014     |      Time: 10 am to 1 pm
You can register here. Or email carlota@kms-world.com with your name, designation, company, official email, phone# for registration. 

QlikView Workshop: Build your first Business Intelligence Application in 1 day

Business Intelligence technologies are a must-have in every business to make informed decisions and keep up-to speed with the ever-evolving markets. QlikView’s disruptive technology makes it a key player and leader in the industry; with its flexibility and powerful analytics environment, building QlikView apps can be mastered by both, business users as well as developers.

You are invited to join Knowledge Management Solutions Pte Ltd for a 1 day QlikView hands-on Training Session in Singapore. The hands-on approach allows you to build a QlikView application that integrates real data from several different sources and presents it in dashboards, analyses and reports.

QlikView Business Intelligence dashboards allow organizations to measure and track the performance of key processes.  QlikView’s click driven, visually interactive interface gives users instant access to top level metrics and record level detail, revealing unanticipated business insights.  Through QlikView disruptive, in-memory associative approach, business users have experiences unprecedented success and satisfaction.


You can register here. Or email carlota@kms-world.com with your name, designation, company, official email, phone# for registration.

Date:  
7th of February, 2014

Time:  
9 am to 6 pm (registration starts at 8:30 am)

Venue:  
55 Market Street #03-01Singapore 048941

Agenda:
1. Introduction to QlikView Business Intelligence
2. Create your Business Intelligence Application with QlikView
Tea Break
3. Data extraction from different sources
4. Data modeling
Lunch break
5. Design of graphs and charts
6. Build your advanced dashboard (Analytics and Reporting)

Notes: This is a paid training event at SGD300 (original price is SGD1,250).