www.enhencer.com
Turn Data to Profit in Minutes
Predict customer's behavior with the most practical Automated Machine Learning platform.

www.enhencer.com/churn-prediction
Churn Prediction
Focus only on 5% of your customers who are 90% likely to leave.Know who they are and how they behave.Take the right actions to the right customers at the right time by decreasing your marketing costs.

www.enhencer.com/purchase-propensity
Predict Purchase Propensity
Increase the positive return of such campaigns up to 90% and learn why and how the marketing campaigns are made effective against which customer group.

Friday, January 25, 2019

What is Robotic Process Automation (RPA)?

Robotic process automation (or RPA) is an emerging form of business process automation technology based on the notion of software robots or artificial intelligence (AI) workers.

Robotic Process Automation is the technology that allows anyone today to configure computer software, or a “robot” to emulate and integrate the actions of a human interacting within digital systems to execute a business process. RPA robots utilize the user interface to capture data and manipulate applications just like humans do. They interpret, trigger responses and communicate with other systems in order to perform on a vast variety of repetitive tasks. Only substantially better: an RPA software robot never sleeps, makes zero mistakes and costs a lot less than an employee.

What is Robotic Process Automation (RPA)?


How RPA Works?

RPA robots are capable of mimicking many–if not most–human user actions. They log into applications, move files and folders, copy and paste data, fill in forms, extract structured and semi-structured data from documents, scrape browsers, and more.

How Robotic Process Automation (RPA) works?
How Robotic Process Automation (RPA) works?
Traditional Workflow Automation Tools vs Robotic Process Automation

In traditional workflow automation tools, a software developer produces a list of actions to automate a task and interface to the back-end system using internal application programming interfaces (APIs) or dedicated scripting language.

In contrast, RPA systems develop the action list by watching the user perform that task in the application's graphical user interface (GUI), and then perform the automation by repeating those tasks directly in the GUI. This can lower the barrier to use of automation in products that might not otherwise feature APIs for this purpose.

Benefits of Robotic Process Automation

  • 100% error reduction
  • 65% cost reduction
  • 75% cycle time reduction
  • High scalability within minutes

Wednesday, January 16, 2019

Hands on Power BI Workshop in Singapore - Dashboard in a Day


Power BI Dashboard in a day is a hands-on workshop for Business Analysts, covering the breadth of Power BI capabilities.

At the end of the workshop you will
  • Understand the value of Power BI
  • Have basic exposure with the product to be able to use it when they return to their office
  • Understand how Power BI differentiates from the competition and become Power BI advocates in their organization
  • Know what the next steps to learn more about Power BI and become part of the community.

The workshop is 200 SGD per attendee. See below for the agenda.


Date       : 15 February 2019 09:00 AM - 05:00 PM
Venue     : 87 Beach Road Chye Sing Building #03-01 Singapore, Singapore 189695
Agenda  :

Morning

– Introduction to Power BI and Power BI Desktop overview

– Power BI Desktop – Lab

– Lunch and demos

Afternoon

– Power BI Service overview

– Power BI service – Lab

– Bring your own data and build dashboards

– Q&A


Wednesday, January 9, 2019

Getting Started with Data Analytics and Visualization Webinar

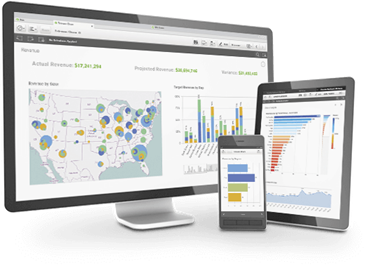
In this free webinar, you will discover how self-service data analytics solution Qlik Sense can help anyone discover insights that Excel or query-based BI tools simply miss, driving data literacy for all skill levels. You will learn to create interactive data visualizations which allow easy drill-down and slice-and-dice and support data driven decision-making process. There will be a step-by-step data visualization dashboard development demo as well as a Q&A in the demo.

Getting Started with Data Analytics and Visualization webinar on January 25th 2019 and February 1st 2019 between 09:30am – 10:30am.

 Getting Started with Data Analytics and Visualization Webinar

Event Information:
Venue                   : Webinar (details will be provided after registration)
Date / Time        : Two alternative sessions are available :
January 25th 2019 – 09:30 to 10:30 AM
February 1st 2019 – 09:30 to 10:30 AM
Agenda                :
-          Introduction to Qlik Sense Data Visualization Platform
-          Self – Service Data Visualization Development Demo
-          Q & A
About Qlik
Qlik® is the leading data analytics platform and the pioneer of user-driven business intelligence. Its portfolio of cloud-based and on-premise solutions meets customers’ growing needs from reporting and self-service visual analysis to guided, embedded and custom analytics, regardless of where data is located. Customers using Qlik Sense®, QlikView® and Qlik® Cloud, gain meaning out of information from multiple sources, exploring the hidden relationships within data that lead to insights that ignite good ideas. Headquartered in Radnor, Pennsylvania, Qlik does business in more than 100 countries with over 45,000 customers globally.
About Avensys Consulting Pte. Ltd.
Avensys is a leader in providing technology enabled business solutions and services. Since inception, Avensys has helped clients use IT more efficiently to improve their operations and profitability, focus on core competencies and achieve business results such as increased agility, innovation and profitable growth. Our in-depth technical knowledge coupled with industry experience and our unique methodologies enable us to successfully deliver and meet our customer’s expectations.
http://aven-sys.com

Friday, November 30, 2018

Insurance Claims Data Analysis and Analytics

This Insurance Claims Data Analysis Dashboard includes Motor Insurance Claims Data based in the UK. The application runs on Qlik Sense Associative Engine which allows users to perform in depth analysis of the claims payments across a wide range of factors including time, location and claim type. In the application you can see how poor data quality and significant outliers can have a direct impact on the performance results of the company.

The Insurance Claims Analytics video below shows how you can use business intelligence to analyze insurance claims data to identify claims fraud, unusual transactions and data quality issues. You can try the Insurance Claims Data Analysis Dashboard yourself here in the demo page.

One of the issues insurance companies face is fraud. Fraud attempts have seen a drastic increase in recent years with the increase in online businesses thus making fraud detection more important than ever. Despite efforts on the part of the affected institutions, hundreds of millions of dollars are lost to fraud each year and quite likely to increase as well. Just like a needle in a haystack relatively few cases show fraud in a large population. Finding these is not just tricky but sometimes impossible too.

A key weapon for insurers in identifying these fraud perpetrators is the analysis of data. In a classical data analysis scenario, insurers need to be able to search for associations in data between similar types of claims, in similar locations, including something unique like a mobile phone number. These associations between the data can lead to a significant increase in identifying the groups of people that commit these types of fraud. This is exactly where a data visualization solution like Qlik Sense can play an important role in this activity.  Qlik Sense can help Insurance Fraud Analysts identify trends, patterns and examples of fraudulent Whiplash claims.

One step further can be predicting which claims are fraud cases using predictive analytics. Predictive analytics do not require insurers to go through the relationships in their data manually and try to find out the cases where fraud probability is high. This task can be tedious if there are many parameters in the claims data but can easily be handled by a predictive model.

For example below, you can see how an automated machine learning tool (Enhencer in the below case) can help to identify fraud cases.


Monday, October 15, 2018

What is Automated Machine Learning (AutoML)?

Machine learning is a field of artificial intelligence that uses statistical techniques to give computer systems the ability to "learn" (e.g., progressively improve performance on a specific task) from data, without being explicitly programmed. This trained machine learning model can later be used to predict the probability of a future event within an acceptable reliability.

For example, suppose that you want to predict the customer churn for a customer. You can use your historic customer data with customers you kept and lost to train a model using machine learning techniques. Later, you can feed a new customer info (or a set of new customer data) to the model and predict their probability to be lost.

This is a two step process. First you train a model and then you use this trained model to predict (or score in machine learning terms) new data.

Machine Learning training and scoring
Although it looks straightforward, traditional machine learning process requires some intermediary steps.  A typical machine learning application, practitioners must apply the appropriate data pre-processing, feature engineering, feature extraction, and feature selection methods that make the dataset amenable for machine learning. Following those preprocessing steps, practitioners must then perform algorithm selection and hyperparameter optimization to maximize the predictive performance of their final machine learning model.

Traditional machine learning process.
Many of these steps are often beyond the abilities of non-experts and automated machine learning (AutoML) addresses this problem. It is the process of automating the end-to-end process of applying machine learning to real-world problems.

As Janakiram MSV writes in Forbes (Why AutoML Is Set To Become The Future Of Artificial Intelligence):
“AutoML focuses on two aspects – Data acquisition and prediction. All the steps that take place in between these two phases will be abstracted by the AutoML platform. Essentially, users bring their own dataset, identify the labels, and push a button to generate a thoroughly trained and optimized model that's ready to predict.”

Automated Machine Learning
For example, take a look at the predictive fraud analytics for insurance sector example below. The AutoML application used here is cloud based Enhencer Predictive Story Teller. After integrating claims data to the predictive system, predictive model creation is done with a few clicks without expertise in data science and statistics (you can watch a more detailed introduction and demo here : Predictive Analytics and Machine Learning Introduction - Customer Propensity Example)


Thursday, October 11, 2018

Predictive Analytics and Machine Learning Webinar - Customer Propensity Example

Beyond business intelligence, where you can slice and dice your historic data to understand what happened and why, predictive analytics will tell you what will happen and make powerful predictions about the future. This will replace intuition based decisions with data driven decision making process. You will also see how powerful machine learning algorithms are open to business users now thanks to self service advanced data analytics tools like Enhencer.

 Enhencer enables business users to use advanced analytics and machine learning on their data without data science knowledge. This allows them to create predictive models on certain metrics within minutes and then predict individual records based on the model (model can be exported to SQL or your favorite BI solution like Microsoft Power BI, Tableau or Qlik).


 For more information please visit https://www.enhencer.com/

Monday, September 10, 2018

Predictive Fraud Analysis - Enhencer (self service data analytics)

Fraud attempts have seen a drastic increase in recent years with the increase in online businesses thus making fraud detection more important than ever. Despite efforts on the part of the affected institutions, hundreds of millions of dollars are lost to fraud each year and quite likely to increase as well. Just like a needle in a haystack relatively few cases show fraud in a large population. Finding these is not just tricky but sometimes impossible too.

Predictive analytics can make fraud detection very easy and help you to seek out the needle in the haystack in no time.
  • Using the dynamic segmentation, you can find the customer segments with the highest fraud rates.
  • Predict the fraud activity
  • You can learn the features of the customer segment likely to become a fraud and take actions to reduce the frauds.


Fast & Powerful Data Analysis

You don't need expensive and complex data science resources to benefit from advanced data analytics. Enhencer enables you to import, analyze and predict in less than few minutes requiring no coding or statistical expertise at all. Enhencer puts the data analysis in a nutshell with 4 steps.

1 - Connect/Upload Data
Upload data of many formats or Import data from various sources like Typeform, Survey Monkey, Google Form and many more in a matter of seconds.

2 - Instant Actionable Insights
Bring down the analysis time from days to minutes as Enhencer empowers the data analysis with decision tree algorithm in an accessible manner for everyone.

3 - Powerful Segmentation
Enhencer is designed with machine learning algorithms that can explore and provide the best & reliable segments automatically no matter the complexity of the data.

4 - Predictive Models
Enhencer builds the perfect predictive model & digs out the variable that truly effects your target automatically leaving you the task of just clicking the predict button.

Predictive analytics segmentation
Advanced data analytics segmentation
Dynamic Data Analytics Features

Enhencer brings all these features together to present the most complete data analysis package featuring from simple & stunning visuals to the most advanced data mining & predictive modeling algorithms. Enhencer also brings machine learning algorithms to the table making the data insights and predictions more accurate and reliable than ever.

Machine Learning Algorithms
Enhencer takes an approach for improving performance and reliability by using machine learning algorithms.

Powerful Segmentation
Enhencer provides powerful & reliable segments automatically from the data using machine learning algorithms.

Stunning Visual Stories
Using intuitive and interactive interface of Enhencer acquire stunning visual stories for all your data types.

Robust Prediction
Predict the unknown using powerful predictive models such as decision tree, random forest, XGBoost & neural network.

Likert & Promoter Score
Survey friendly features to spot the business growth opportunities that no other data analysis packages provide.

Flexible Integrations
Connect and integrate the different data sources from online data collection platforms and database platforms.


For more information, demo-request or free trial, please visit www.enhencer.com