www.enhencer.com
Turn Data to Profit in Minutes
Predict customer's behavior with the most practical Automated Machine Learning platform.

www.enhencer.com/churn-prediction
Churn Prediction
Focus only on 5% of your customers who are 90% likely to leave.Know who they are and how they behave.Take the right actions to the right customers at the right time by decreasing your marketing costs.

www.enhencer.com/purchase-propensity
Predict Purchase Propensity
Increase the positive return of such campaigns up to 90% and learn why and how the marketing campaigns are made effective against which customer group.

Showing posts with label Qlik. Show all posts

Wednesday, January 9, 2019

Getting Started with Data Analytics and Visualization Webinar

In this free webinar, you will discover how self-service data analytics solution Qlik Sense can help anyone discover insights that Excel or query-based BI tools simply miss, driving data literacy for all skill levels. You will learn to create interactive data visualizations which allow easy drill-down and slice-and-dice and support data driven decision-making process. There will be a step-by-step data visualization dashboard development demo as well as a Q&A in the demo.

Getting Started with Data Analytics and Visualization webinar on January 25th 2019 and February 1st 2019 between 09:30am – 10:30am.

 Getting Started with Data Analytics and Visualization Webinar

Event Information:
Venue                   : Webinar (details will be provided after registration)
Date / Time        : Two alternative sessions are available :
January 25th 2019 – 09:30 to 10:30 AM
February 1st 2019 – 09:30 to 10:30 AM
Agenda                :
-          Introduction to Qlik Sense Data Visualization Platform
-          Self – Service Data Visualization Development Demo
-          Q & A
About Qlik
Qlik® is the leading data analytics platform and the pioneer of user-driven business intelligence. Its portfolio of cloud-based and on-premise solutions meets customers’ growing needs from reporting and self-service visual analysis to guided, embedded and custom analytics, regardless of where data is located. Customers using Qlik Sense®, QlikView® and Qlik® Cloud, gain meaning out of information from multiple sources, exploring the hidden relationships within data that lead to insights that ignite good ideas. Headquartered in Radnor, Pennsylvania, Qlik does business in more than 100 countries with over 45,000 customers globally.
About Avensys Consulting Pte. Ltd.
Avensys is a leader in providing technology enabled business solutions and services. Since inception, Avensys has helped clients use IT more efficiently to improve their operations and profitability, focus on core competencies and achieve business results such as increased agility, innovation and profitable growth. Our in-depth technical knowledge coupled with industry experience and our unique methodologies enable us to successfully deliver and meet our customer’s expectations.
http://aven-sys.com

Friday, November 30, 2018

Insurance Claims Data Analysis and Analytics

This Insurance Claims Data Analysis Dashboard includes Motor Insurance Claims Data based in the UK. The application runs on Qlik Sense Associative Engine which allows users to perform in depth analysis of the claims payments across a wide range of factors including time, location and claim type. In the application you can see how poor data quality and significant outliers can have a direct impact on the performance results of the company.

The Insurance Claims Analytics video below shows how you can use business intelligence to analyze insurance claims data to identify claims fraud, unusual transactions and data quality issues. You can try the Insurance Claims Data Analysis Dashboard yourself here in the demo page.

One of the issues insurance companies face is fraud. Fraud attempts have seen a drastic increase in recent years with the increase in online businesses thus making fraud detection more important than ever. Despite efforts on the part of the affected institutions, hundreds of millions of dollars are lost to fraud each year and quite likely to increase as well. Just like a needle in a haystack relatively few cases show fraud in a large population. Finding these is not just tricky but sometimes impossible too.

A key weapon for insurers in identifying these fraud perpetrators is the analysis of data. In a classical data analysis scenario, insurers need to be able to search for associations in data between similar types of claims, in similar locations, including something unique like a mobile phone number. These associations between the data can lead to a significant increase in identifying the groups of people that commit these types of fraud. This is exactly where a data visualization solution like Qlik Sense can play an important role in this activity.  Qlik Sense can help Insurance Fraud Analysts identify trends, patterns and examples of fraudulent Whiplash claims.

One step further can be predicting which claims are fraud cases using predictive analytics. Predictive analytics do not require insurers to go through the relationships in their data manually and try to find out the cases where fraud probability is high. This task can be tedious if there are many parameters in the claims data but can easily be handled by a predictive model.

For example below, you can see how an automated machine learning tool (Enhencer in the below case) can help to identify fraud cases.


Tuesday, January 24, 2017

Qlik Sense subscription pricing model

Qlik has finally announced the general availability of its Qlik Sense Cloud Business Platform. Qlik Sense tokens on cloud will now be available for only 25 USD per user per month. With this addition, Qlik Sense now offers following cloud pricing models :

  • Qlik Sense Cloud Basic is free,
  • Qlik Sense Cloud Plus is priced at 20 USD per user per month,
  • Qlik Sense Cloud Business is priced at 25 USD per user per month.

Qlik Sense Cloud Basic and Plus are for individuals. Basic model has a limitation to share your dashboards with up to 5 users. The newly announced Qlik Sense Cloud Business targets groups and teams and features collaborative and operationalized analytics with group-level governance, coauthoring workspace and automated data refreshes.

Qlik Sense perpetual pricing model has 2 options : Qlik Sense Desktop is free and Qlik Sense Enterprise is 1,500 USD per user and also requires 20% annual license maintenance.

Qlik Sense cloud subscription pricing model
Qlik Sense licensing is based on a flexible and simple token model. Qlik customers buy tokens and are able to allocate and reallocate these tokens to adapt to changing usage needs over time. Tokens can be allocated by customers to either named individuals who need frequent access to the system, or to pools of access for groups of users who use the system infrequently.

For more information about Qlik Sense token licensing download Qlik Sense Token Licensing PDF.


Thursday, September 3, 2015

Free Qlik Sense / QlikView Demo Session in Singapore on September 16th

Qlik has recently released a new version and more mature version of Qlik Sense, Qlik Sense 2.0, and also a brand new concept / platform named Qlik Analytics Platform. Besides, Qlik Sense now also has a cloud version where you can use this cutting edge data visualization software as SaaS.

There will be a QlikView / Qlik Sense introduction event at 9am - 11am on 16th September 2015 in Singapore Management University. In this event, you will not only have a chance to learn about Qlik product and platform family, you will also have chance to see the newest features of Qlik Sense and QlikView.

This event is a free and for registration and details you can visit Free Qlik workshop for Business Users and IT professionals: Interactive Business Reporting and Analysis with QlikView & Qlik Sense page.

Qlik Sense
Qlik Sense
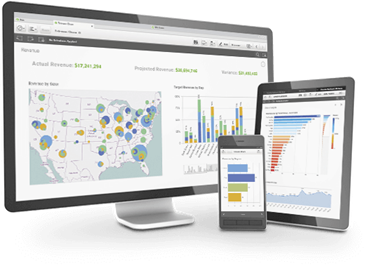
Imagine analytics so intuitive, anyone in your company could easily create personalized reports and dynamic dashboards to explore vast amounts of data and find meaningful insights. And imagine if this could be done while ensuring accuracy and reliability of data and analytics. That’s Qlik Sense —a revolutionary visual analytics platform that supports self-service visualization, guided analytics apps and dashboards, embedded analytics, and reporting, all within a governed framework that offers enterprise scalability and trust for IT.

QlikView
The QlikView Business Discovery platform delivers true self-service BI that empowers business users by driving innovative decision-making.

Monday, August 31, 2015

Qlik Sense Cloud

Qlik's self-service business intelligence Qlik Sense now has a cloud based offering which is named Qlik Sense Cloud. This is a hosted, Software as a service, version of Qlik Sense where you can privately share your applications with others.

Qlik Sense Cloud pricing information is currently not available and in fact, the current version is free! You can add up to 5 users freely to view your Qlik Sense application on your cloud. Currently the total app size is restricted to 1 GB and each Qlik Sense application cannot be more than 25 MB in size.

Below, you can watch a nice introduction and getting started to Qlik Sense Cloud video.


You can simply create your Qlik Sense applications on Qlik Sense Desktop (also freely available) and upload them to your Qlik Sense cloud. Below in Qlik Sense Cloud - Registration and Orientation video, Michael Tarallo from Qlik shows how easy it is to register with Qlik Sense Cloud.

Friday, August 14, 2015

Sales Performance, Pipeline and Productivity Data Analysis Dashboard Demo by Qlik Sense

Would monitoring the health of your pipeline by region, industry, function, rep, division, etc. help you improve forecast accuracy? Are you remaining competitive in your industry and can you identify areas for improvement to increase your win rate? 

Sales Performance, Pipeline and Productivity Data Analysis model holds the sales opportunities in pipe and closed business. Additional information like region, division, customer industy, segment and function is available to dissect, analyze and forecast. Finally, there is a competitive analysis view to see who the company compete against and the company's effectiveness in those competitive situations.

The application consist of the followign views :

  • Dashboard - This view shows the current quarter's sales pipeline.
  • Performance / Effectiveness Dashboard - This view helps to analyze the current quarter sales performance (Quote, Pipeline, Revenue) by region and Sales rep.
  • Pipeline Analysis Dashboard - This dashboard helps to deconstruct the sales pipeline by aging, sector and function.
  • Quote Analysis Dashboard - This dashboard helps to verify quote attainment by region and sales representative.
  • Competitive Analysis Dashboard - This dashboard helps to explore the competitive landscape and review wins and losses.
You can access this Qlik Sense Sales Performance Analysis Dashboard here : Sales Performance, Pipeline and Productivity Data Analysis Dashboard


Sales Performance, Pipeline and Productivity Data Analysis Dashboard Demo by Qlik Sense

Supply Chain - Inventory and Product Availability Dashboard Demo by Qlik Sense

This Supply Chain - Inventory and Product Availability Dashboard demo application provides visibility into inventory levels (in-store, depot, and in transit) and potential insights into availability through out of stock measures and sales information. Lack of availability can mean lost potential sales. Too much inventory creates excess costs.

The demo app is designed to give visibility into the Retail environment to Consumer Products companies. The source data is the Retailer who makes information available from their store EPOS and depot systems to the Consumer Goods company.

This demo gives consumer goods company and any retailers a picture of product stock levels in store, depot and in transit, as well as sales analysis. The app supports Consumer Products companies in their effort through allowing users to reduce out-of-stocks and lost sales potential, as well as identifying potential alternative sources of replenishment.

This data can be viewed at the multiple levels and locations, in providing Consumer Products companies with detailed insights to support key business processes such as forecasting, demand and supply management.

This Qlik Sense demo is available online and you can access it by filling Data Analytics with Qlik Demo/App Request Form (select "Supply Chain - Inventory and Product Availability Dashboard Demo by Qlik Sense" in drop down).

Data visualization for suppply chain and inventory
This Qlik Sense supply chain, inventory and product availability dashboard demo illustrates how you can use Qlik Sense to potentially gain insights through visualizations and try to optimize inventory and availability not just one side of the equation.
About Qlik Sense

Qlik Sense analytics software is a business intelligence tool designed for the enterprise. Developed by Qlik, the company behind popular QlikView Business Intelligence Platform, Qlik Sense makes visual dashboard creation simple and intuitive, but doesn’t stop there. Qlik Sense also makes it easy to explore the data so you can understand what’s happening and why. Ask questions. Follow your intuition. Seamlessly navigate vast amounts of data from multiple sources. Then share your insights visually and accurately with other users directly or through the cloud.

Tuesday, August 11, 2015

Retail Store Performance Dashboard Demo

Retail Store Performance dashboard demo is a free, online QlikView demo which showcases how an interactive business intelligence platform can be used to analyze the performance of stores from a regional level all the way down to the individual store level. The user can analyze sales versus budget, sales versu target, customer satisfaction, Year to date scorecard for regions, as well as detailed sales trends and numbers. The application also has an integrated map chart where the user can perform geospatial analysis.

The Retail Store Performance dashboard ties corporate strategy to store level execution at all levels of the store operations hierarchy.  Timely and accurate store performance metrics can be analyzed in the corporate office, in a store, or through a mobile device for traveling store operations and field management.

You can access the application by filing Data Analytics with Qlik Demo/App Request Form (select "Retail Store Performance Dashboard Demo" in the drop-down menu).

QlikView Retail Store Performance Dashboard
Retail Store Performance Dashboard showcases how QlikView can be used to analyze retail store data from regional level all the way down to the individual store level.
About QlikView

QlikView is one of the most popular business intelligence platforms which offers revolutionary in-memory, associative data analysis at your finger tip. Focused on easy and smooth end user experience, the platform enables easy search and access to data with state-of-the-art visualization as well as Google like easy to use and intuitive experience.

Monday, August 10, 2015

How Qlikview works?

The core feature of QlikView is an in-memory, associative data model which feeds the visualization in a very unique way. In a traditional business intelligence application, the data visualization layer interacts with data through queries which are basically scripts executed by the platform. So if you for example select a country to drill-down to the sales numbers in that country, the data visualization layer runs a script, queries the data, retrieves the data from the data layer and updates the charts and reports in the screen.

QlikView on the other hand do not use this query mechanism. Application and data layer are tightly integrated in QlikView and data relationships are handled in engine level not application level. This means the QlikView charts and reports are integrated with in-memory data model and they know how to filter themselves when user drills down.

The mechanism above help QlikView developers to write significantly less software scripts which shortens the development and makes maintenance easy. Plus, in-memory integration of QlikView application layer and data model enables fast execution which usually eliminates the necessity to aggregate the operational data for performance reasons.


Wednesday, August 5, 2015

Credit Risk Management Dashboard Demo by QlikView Business Intelligence Platform

Business and risk have always been seen to go hand-in-hand and the need for banks to strengthen their risk management framework is vital. Exposing the true risk profile to the users has been a challenging business problem due to multiple data sources and differences in operational processes and metric definitions.

To mitigate this situation, a financial institution should provide a holistic view of the risks faced by the organization at any point in time. When up-to-date information on risks can be analyzed and put at the users fingertips, firms will inevitably find it easier to maximize profit AND reduce risk.

The purpose of the Credit Risk Management demo is to illustrate how QlikView can be used by a
financial institution to manage credit risk. By providing a unified picture to the entire business, QlikView helps everyone have the same, up to date, picture of their risk exposure instead of disparate spreadsheets floating around the business. Credit Risk data is also interesting to the entire Business, not only the Credit Analysts. Are we pricing the products correctly? Are we in compliance with regulations? Should we continue to do business in a specific market or geographic segment? These are all questions that could be asked against Credit Risk data.

QlikView Credit Risk Management Dashboard application is designed to cover the following main analysis areas:
  • Exposure Concentration Analysis (Exposure : The total amount of credit extended to a client by the lending company)
  • Correlation Analysis
  • Probability of Default (PD) Analysis (The likelyhood that a borrower will default on their loans)
  • Exposure Comperison
  • Capital Allocation Modeling
The application allows you to load your own data. If you download the zip file below, you will see a RiskData Excel file in it. You can input your data in this format by simply opening Credit Risk Management Dashboard app and selecting File > Reload.

You can access the application by following the below links:
QlikView Credit Risk Management Dashboard Template online demo
QlikView Credit Risk Management Dashboard QVW file (opens with QlikView)


QlikView for Salesforce.com

Salesforce is the of the most popular cloud based Customer Relationships Management (CRM) product available in the market today. Organizations today invested in Salesforce.com today can also enjoy the business intelligence interfaces provided for them to make sense of Salesforce data. But leaving CRM functionality in Salesforce.com while integrating the data from Salesforce into a more flexible but third party BI platform has definite advantages. For example, you can blend data from Salesforce and other in-house systems to analyze it together.

QlikView provides a Salesforce connector which can extract data into QlikView to develop powerful analysis, reports and dashboards and empower users with rich and interactive visualization. These dashboards in return will help you to improve key CRM KPIs like sales forecast accuracy, pinpoint cross-sell and up-sell opportunities and achieve more customer centric service and support delivery.

You can instantly try out how a QlikView dashboard for Salesforce.com works using QlikView for Salesforce template. This QlikView application is designed specifically to provide Salesforce users with key pipeline-related data at their fingertips. The application allows you to easily load and analyze all your CRM information directly from your salesforce.com account.

With QlikView for Salesforce, information can be explored intuitively and visually – with drill-down detail in just a few clicks. Reloading your own data must be performed on your local machine. Before attempting to reload your own data, please download the QVW and print the white paper using the links below.

QlikView for Salesforce Template Package Links:

QlikView for Salesforce dashboard screenshot
QlikView for Salesforce provides ready to use business intelligence dashboard for Salesforce customers.
Please fill in QlikView for Salesforce.com Template Request form so we can send you the package below :
  • QlikView Template for Salesforce Online Application (Opens in Web Browser)
  • QlikView Template for Salesforce.com video demo (mp4)
  • Download QlikView Template for Salesforce.com QVW file (QlikView Application File) - You will need a licensed QlikView Desktop application to open this file.
  • Download QlikView Template for Salesforce.com Self Executable EXE file  - You do not need QlikView desktop to open and run this.

Tuesday, August 4, 2015

QlikView for SAP: How to unlock the value of your data hidden in SAP

QlikView is one of the most popular business intelligence platform today. Its popularity is not an accident. With its super fast and user-friendly data discovery interface, rapid development cycle, fast response time, it provides a very capable platform to extract the hidden value in the enterprise data.

SAP is on the other hand one of the most popular ERP solutions in the market today. Although it also provides BI capabilities, many customers choose QlikView as their BI platform to extract data from SAP. With QlikView, you can consolidate information from SAP BI, SAP R/3 or any other data source easily and then search and analyze this data with Google-like ease and speed. QlikView also provides a QlikView Connector for SAP Netweaver which enables SAP customers to get easy and quick access to all the data hidden in different SAP systems in QlikView.

KMS, an authorized QlikView partner in Singapore is having a free event named "QlikView for SAP: How to unlock the value of your data hidden in SAP" on 13th August 2015, 9:30am - 11am, Singapore Management University. In this event several aspects and benefits of using QlikView as data analysis and business intelligence platform on top of SAP installation.

QlikView for SAP event in Singapore will present the benefits of QlikView BI platform for SAP users.

You can follow the link or image below for details and registration :

QlikView for SAP Event


Saturday, November 1, 2014

Introduction to Qlik Sense in Singapore

Qlik has recently intoduced its brand new product, Qlik Sense, and as a Qlik partner, Knowledge Management Solutions is starting a series of apps build events in the upcoming months to introduce this exiting new product.

Known as "Build Your First Data Visualization Dashboard in half-day", this 4 hours free Qlik Sense introduction offers a hands-on experience with this new self-service Business Intelligence solution. Qlik Sense free desktop application will be used in the session so there is not license cost at all.

The apps build session is on 9th January 2015 between 10:00 AM and 14:00 PM and will cover a hands-on session where you will build your first Qlik Sense Business Intelligence Dashboard with a Qlik Sense expert. See below for details and to register.

Build Your First Data Visualization Dashboard in half-day!
Data Analytics with Qlik Sense

You are invited to join Knowledge Management Solutions Pte Ltd for Data visualization by Qlik Sense Desktop Session.

The hands-on approach allows you to build a Qlik Sense application that integrates real data from several different sources and presents it in dashboards, analyses and reports.  Qlik Sense Business Intelligence dashboards allow organizations to analyze data quickly.  Its intuitive user interface means there’s no need for canned reports, dashboard widgets, or templates to get started. Through Qlik Sense’s disruptive, in-memory associative approach, business users have experiences unprecedented success and satisfaction.

Qlik Sense
Who should attend?
Business people, General Managers, Analysts, Operations Managers, IT Managers, HR Managers, Finance Managers, Marketing Managers, Sales Managers, Service Managers, etc.

What you will learn during the hands-on session:
You will build your first Qlik Sense Business Intelligence Dashboard.


This training will be provided by our key consultants who on average have more than 15 years of experience in Business Intelligence and Analytics.

Seats are limited hence we encourage you to register early to secure your seat(s).

Date: 6th March 2015 (Let us know if this date does not work for you. We will inform you for the next event).
Time: 10 am to 2 pm (registration starts at 9:45 am)

Venue:  9 Temasek Boulevard #17-02, Suntec Tower Two S(038989), Singapore
Agenda:
1. Introduction to Qlik Sense Business Intelligence
2. Create your Business Intelligence Application with Qlik Sense
Tea Break
3. Data extraction from different sources
4. Data modeling
5. Design of graphs and charts
6. Build your advanced dashboard (Analytics and Reporting)

If you would like to join us kindly send an email to levent@kms-world.com with your name, designation, company, and official email and phone details or click below to register.


Qlik Sense has been launched on September 17th 2014 a few months after its free desktop application was released. Qlik Sense is built on the QIX Associative Data Indexing engine, the second generation of Qlik’s proven and patented engine technology. Associative data engine leaves data associations to Qlik Sense platform which frees users from IT stuff like writing queries or connecting filters and charts with each other. On top of this, Qlik Sense also offers a drag-and-drop application development environment which allows business users to develop their small to medium size BI applications without relying too much on it.

Below you can watch an introduction video.

Wednesday, September 17, 2014

Qlik Sense vs QlikView

Qlik has finally released its long awaited Qlik Sense platform on 17th September 2014. Qlik Sense is a next-generation self-service data visualization application from Qlik (see more here What is Qlik Sense?). According to Qlik, Qlik Sense is built on the QIX Associative Data Indexing engine, the second generation of Qlik’s proven and patented engine technology.

It has some dramatic changes compared to QlikView, such as drag-and-drop visualization, server side dashboard development and distribution, a token based pricing (Qlik Sense pricing), overhauled data extraction, integrated maps, new charts, etc.

Is Qlik Sense new QlikView or QlikView 12? The answer is no. Qlik started the project as QlikView,Next which was implying that the next product will be the new version of QlikView which is on version 11 released in 2011. But Qlik has changed the name to Qlik Sense. It makes sense because this product is different. Not entirely but different.

Conceptually, Qlik Sense and QlikView targets different types of BI. Here is the semi-official explanation of QlikView versus Qlik Sense which is taken from Qlik Community:

QlikView is a tool for situations where you want prepared business applications, i.e. applications created by developers who put a lot of thought into the data model, the layout, the charts and the formula; and deliver the applications to end-users who consume the applications. Qlik calls this Guided Analytics. The end-user has total freedom to explore data, select, drill down and navigate in the information, and can this way discover both questions and answers in the data. The end-user is however limited when it comes to creating new visualizations. This type of situation will without doubt be common for many, many years to come. For more information on Qlik View, refer to our What is QlikView? QlikView Overview post. 
Qlik Sense is a tool for situations where you don’t want to pre-can so much. Instead you want the user to have the freedom to create a layout of his own and in it, new visualizations; charts that the developer couldn’t imagine that the user wants to see. You want Self-service data discovery, which means a much more active, modern, engaged user. In addition, Qlik Sense is much easier to use when you have a touch screen, and is adaptive to different screen sizes and form factors. On the whole, Qlik Sense is a much more modern tool. (Source : Qlik Sense or Qlik View)
To find out more about Qlik Sense you can check Qlik Sense for beginners.

Technically, Qlik Sense seems to use the same data engine and expression syntax in the back-end. Front end is entirely different. But what would be the road map than? Would Qlik Sense and QlikView merge? There is no official roadmap for now but here are sum hints for the future from Henric Cronström, VP for Product in QlikView:

One of the main goals for Qlik Sense was to have one unified client that could run on anything  (=html5). Another goal was to generalize the chart drawing code, so that more graph types could be implemented (=extensions). A third goal was that the client needed to be adaptable to screen sizes and form factors.

These three goals meant total incompatibility with the existing C++ client, and - unfortunately - only a partial backward compatibility. So, we had to start developing from scratch, but to re-implement all functionality from QlikView 11 in a new tool would take a very long time. And, we just haven't done it yet...

I am not allowed to tell you what we have planned for the future, but I can see several possible scenarios: Merge the two products. Or, QlikView disappears because Qlik Sense is so much better. Or, the two products continue in parallel: QlikView survives and flourishes since it is much more flexible and allows for a much greater customization and Application building.

We will see. I can only promise that Qlik will listen to the customers and make decisions based on the feedback. (Source : Qlik Sense or Qlik View)
What I understand (as many does) from this post is that Qlik is actually working to merge both products but it is still WIP. It seems very likely that both products will merge since Qlik also did not made any major upgrade to its now aging QlikView 11. Maybe QlikView 12 will never be a reality and instead we will see a new Qlik Sense version (a server) which handles all QlikView and Qlik Sense applications on a single platform.


A must have QlikView reference.

Qlik Sense for Beginners

Qlik Sense Pricing

Qlik has launched its long awaited product named Qlik Sense. Composed of Qlik Sense, a governed, server-based data visualization and discovery application, and Qlik Sense Desktop, a free Windows desktop self-service data visualization application, the new suite enables server side BI development and distribution, drag-and-drop visualization, smart search and data storytelling.

Qlik Sense pricing is also completely overhauled. The licensing in Qlik Sense (Server) is based on tokens, which are used to allocate access passes that allow users to access Qlik Sense. Token-based licensing model of Qlik Sense is to provide greater flexibility for license management. Qlik Sense tokens can be allocated to named users, or leveraged across multiple login sessions for one or more users. With the token-based licensing model, customers can deploy multiple servers, across multiple geographies, to optimize for performance and availability without paying any additional costs.

Qlik Sense pricing has not been publicly published yet so we cannot write the prices here. If you are in Singapore, Malaysia, Thailand or Indonesia, you can contact us through levent@kms-world.com because in this regions we can help you to understand pricing. For other countries,if you are interested in to find out more about Qlik Sense token pricing and Qlik Sense server pricing, you engage with a local Qlik account manager.

Here are also some useful pages to explore Qlik Sense more:


Also check out these Qlik Sense Resources

Learning Qlik Sense

Qlik Sense for Beginners

Qlik launced full Qlik Sense Product

The wait is over. Qlik, one of the leading data discovery solution provider, has launched Qlik Sense, its device-independent, self-service visualization and discovery product engineered for enterprise-class governance and performance. Qlik Sense product suite is composed of Qlik Sense, a governed, server-based data visualization and discovery application and Qlik Sense Desktop, free Windows desktop self-service data visualization application.

Here is the full press release from Qlik :

Qlik, a leader in data discovery, today introduced general availability of Qlik Sense, the first device-independent, self-service visualization and discovery product engineered for enterprise-class governance and performance.  Built on a modern architecture and powered by the patented, industry-proven Qlik data indexing engine, Qlik Sense gives users the unrestricted ability to create personalized data analyses and explore the relationships that exist in data to reveal connections instantly. Qlik Sense is designed to serve audiences equally without compromise: business users gain the intuitive experience they need, developers gain boundless possibilities for what they can create and IT gains centralized control for management and governance.

Just as Qlik disrupted the business intelligence (BI) industry to pioneer the data discovery category, the company is now leading the next transformation as the category matures to governed, user-driven creation with the launch of Qlik Sense. According to Gartner, Inc.’s 2014 Magic Quadrant for Business Intelligence and Analytics Platform report , “By 2015, enterprise buyers of BI platforms will predominantly purchase platforms that support both strong and broad business-user-accessible data discovery capabilities and IT-driven enterprise features for data reuse, governance, security and scalability.”

“Our vision for Qlik Sense builds on our belief that anyone in an organization should be able to easily create dynamic dashboards to explore their data to uncover meaningful insights,” said Lars Björk, Qlik CEO. “When we set out to create Qlik Sense, we envisioned a world where every knowledge worker, from any device, could rapidly create visually rich analytics to explore theories, prove hypothesis, or discover new trends that can change the trajectory of their business.”

“We have been very impressed with Qlik Sense so far.  For us, simplicity of delivery is key, and it allows us to accelerate the delivery of actionable analytics to the right people at the right time,” said Perry Willis, Head of Information Technology EMEA at Colliers International. “Although we have strong QlikView skills in the IT team, so creation of applications is easy, Qlik Sense allows even greater creation flexibility so we can do more, faster. The synergy we are rapidly developing by using both QlikView and Qlik Sense is helping us provide our Real Estate advisors across 40 countries in EMEA smarter analytics solutions.”

Qlik Sense is the first offering to deliver self-service BI based on a server-side development and distribution model. Whereas most products require separate developer licenses and leverage the traditional approach of develop and publish, Qlik Sense empowers every user with the full capability to create, customize, or extend visualizations from any device, at any point in time.

“The problem with self-service BI has always been that you either get rich BI capability with weak usability, or a very approachable product with limited analysis capability,” said Anthony Deighton, Qlik CTO and Senior Vice President of Products. “With Qlik Sense, we set out to change that. That’s why we built Qlik Sense on the second generation of our patented associative data indexing engine, but gave it a rich, modern visualization front-end that is intuitive, yet powerful.”

Qlik Sense offers the first server side development and distribution model for self-service BI.


Smart Search and Smart Visualizations Accelerate Time to Insight
Qlik Sense lets users create apps through a drag-and-drop experience that delivers relevant analysis, interactive reports, and dashboards critical to decision-making and operations. Users can freely explore their intuition since they are not limited to predefined paths they must follow or questions they must formulate ahead of time. The Qlik associative data indexing engine allows users to easily expose relationships among data dimensions, uncovering insights that would have been hidden in traditional hierarchical, query-based data models. This provides users with the freedom to explore data at any point in their analysis.

Smart Search allows a user to simply type words or numbers to begin analysis of a data set. When a user types in a search string, Smart Search connects the dots, uncovering data relationships and information in locations that might otherwise be unnoticed. In addition, intuitive Smart Visualizations uncover all the relationships between data dimensions, revealing insights that would have been hidden in traditional data models. These cues help users explore patterns by dynamically updating and highlighting new information and associations.

Qlik Sense offers Drag-and-drop visualizations
Qlik Sense offers Drag-and-drop visualizations 

Anytime, Anywhere Collaboration Enables Broader Knowledge Sharing

Qlik Sense puts the social and collaborative experience front and center.  Workgroups and teams can collaborate by collectively sharing analyses anytime, anywhere, and on any device. Its touch-driven interface and responsive design automatically adapts visualizations for the best possible experience on any device.

Data Storytelling allows multiple users, on any device to share their insights at a point in time in presentation format. Users can add commentary and narrative and drill down directly from the presentation to Qlik Sense to answer questions on the fly. This helps to drive communication of insight and facilitates group discovery.

Enterprise-Class Governance and Security Provides Centralized Control

With Qlik Sense, users can build their own visualizations from a centralized library of pre-built data sets, expressions, and visualizations to ensure consistent use of data and values.  Its modern architecture allows new capabilities for governance and manageability to support workgroup and distributed enterprise environments, including license allocation and usage monitoring in an easy-to-use interface that saves time and simplifies troubleshooting. It also enables IT to implement enterprise-level security requirements with a flexible security-rules engine that offers granular control for progressive development with powerful audit and logging.

In addition, Qlik Sense supports robust data integration to transform and combine multiple, disparate data sources and provide seamless analysis across them, including fast calculations, associative exploration, and search. Its open and powerful APIs give developers the ability to embed Qlik Sense into web pages and custom applications, and extend core capabilities to meet custom needs.

Availability and Pricing

Qlik Sense is available today. The Company has also introduced a new, more flexible token-based licensing model for Qlik Sense to provide greater flexibility for license management. Qlik Sense tokens can be allocated to named users, or leveraged across multiple login sessions for one or more users. With the token-based licensing model, customers can deploy multiple servers, across multiple geographies, to optimize for performance and availability without paying any additional costs. For more pricing information, contact Qlik or one of its registered partners.

In addition to offering the complete Qlik Sense offering for interactive visualization, Qlik will continue to offer its market-proven platform, QlikView®, to provide application development that enables analysts with minimal development expertise to build and publish powerful analytical applications. Qlik Sense Desktop, (www.qlik.com/us/explore/products/qlik-sense/desktop) will also continue to be available as a free download.