www.enhencer.com
Turn Data to Profit in Minutes
Predict customer's behavior with the most practical Automated Machine Learning platform.

www.enhencer.com/churn-prediction
Churn Prediction
Focus only on 5% of your customers who are 90% likely to leave.Know who they are and how they behave.Take the right actions to the right customers at the right time by decreasing your marketing costs.

www.enhencer.com/purchase-propensity
Predict Purchase Propensity
Increase the positive return of such campaigns up to 90% and learn why and how the marketing campaigns are made effective against which customer group.

Showing posts with label QlikView Finance. Show all posts

Wednesday, August 5, 2015

Credit Risk Management Dashboard Demo by QlikView Business Intelligence Platform

Business and risk have always been seen to go hand-in-hand and the need for banks to strengthen their risk management framework is vital. Exposing the true risk profile to the users has been a challenging business problem due to multiple data sources and differences in operational processes and metric definitions.

To mitigate this situation, a financial institution should provide a holistic view of the risks faced by the organization at any point in time. When up-to-date information on risks can be analyzed and put at the users fingertips, firms will inevitably find it easier to maximize profit AND reduce risk.

The purpose of the Credit Risk Management demo is to illustrate how QlikView can be used by a
financial institution to manage credit risk. By providing a unified picture to the entire business, QlikView helps everyone have the same, up to date, picture of their risk exposure instead of disparate spreadsheets floating around the business. Credit Risk data is also interesting to the entire Business, not only the Credit Analysts. Are we pricing the products correctly? Are we in compliance with regulations? Should we continue to do business in a specific market or geographic segment? These are all questions that could be asked against Credit Risk data.

QlikView Credit Risk Management Dashboard application is designed to cover the following main analysis areas:
  • Exposure Concentration Analysis (Exposure : The total amount of credit extended to a client by the lending company)
  • Correlation Analysis
  • Probability of Default (PD) Analysis (The likelyhood that a borrower will default on their loans)
  • Exposure Comperison
  • Capital Allocation Modeling
The application allows you to load your own data. If you download the zip file below, you will see a RiskData Excel file in it. You can input your data in this format by simply opening Credit Risk Management Dashboard app and selecting File > Reload.

You can access the application by following the below links:
QlikView Credit Risk Management Dashboard Template online demo
QlikView Credit Risk Management Dashboard QVW file (opens with QlikView)


Friday, October 3, 2014

Asset Management Dashboard Demo by QlikView Business Intelligence Platform

Asset Under Management analysis is an important part of any financial institution in asset management, private banking and wealth management business. The data can be quite huge and data from many different sources need to be combined to get the big picture. Unfortunately, this process is quite manual in many organizations where plain old MS Excel is used  to perform analysis with usually poor results.

We have seen that a powerful business intelligence platform can be leveraged for wealth management, asset management and private banking institutions to increase analyis productivity greatly. But what is developed is usually not public (even dashboard layouts are protected) so you can not see a lot of nice asset management business intelligence dashboards.

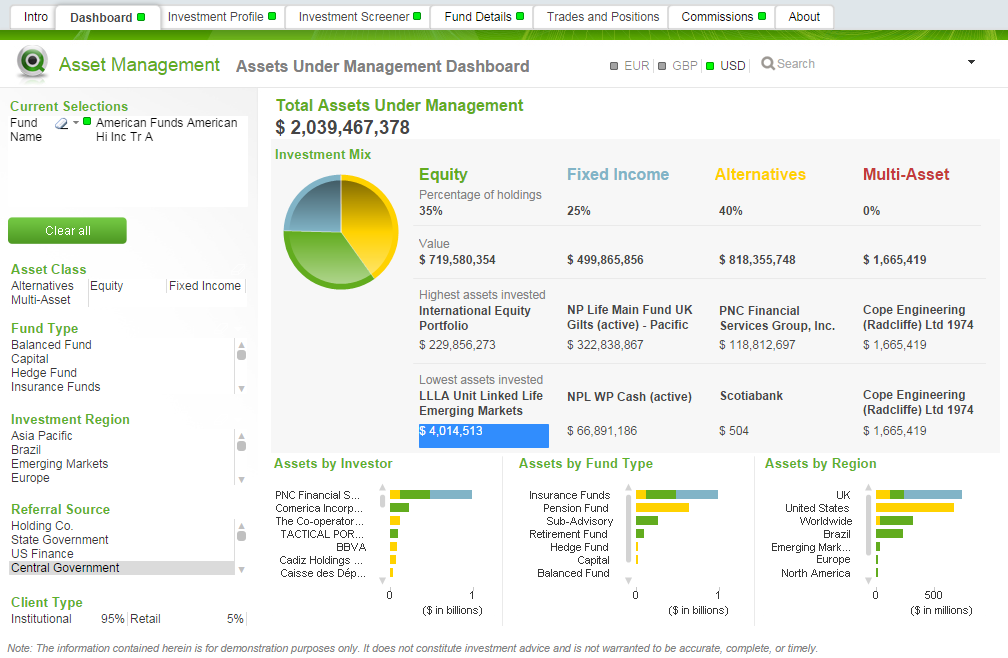
This rare Asset Management demo provides an analysis of assets under management by various dimensions such as asset class, investor, fund type and region. Users can look up funds and their performance and analyze fund details. The source data are from multiple systems such as AUM, Positions, Risk, Returns, Traiding, Portfolio etc. It also contains a capability to look up a group of CUSIPs on finger tips.

The demo application is developed on powerful QlikView Business Intelligence platform which is heavily used in many finance and banking companies.

The Asset Management application contains an Asset Under Management Dashboard to analyze Overall AUM summary by asset class, investor, fund type, as well as region, Investment Profile View, Trades and Positions Analysis View, Investment Screener View (Multiple fund performance and assets under management summary) and Fund Details view where users can access to an Excel-like pivot table ad-hoc analysis of fund details.

In Investment Profile view, when you select a specific fund, you can print the report in PDF with a simple button click.

Asset Under Management Dashboard
Asset Under Management Dashboard Demo

Free access to QlikView Asset Management Dashboard

You can try Asset Management Dashboard demo by accessing the free public demo application. Fill in your name, e-mail and phone to the below form and press submit button. You will receive an e-mail links to web based dashboard (you can also access through mobile devices), a self-executable file for you to try it locally (no QlikView license required) and supporting material such as demo video.

Please fill in Data Analytics with Qlik Demo/App Request Formform (select "Asset Management Dashboard Demo by QlikView Business Intelligence Platform" in dropdown).

Thursday, September 11, 2014

Swiss Health and Accident Insurer Helsana choses QlikView

Helsana Group, a leading health and accident insurer in Switzerland, will use uses QlikView Business Intelligence platform to consolidate and analyze data from Teradata, Microsoft and Oracle data warehouses. QlikView will enable Helsana users to perform quick and easy data analysis in the areas of sales, management control and information management.

Helsana required a dynamic analysis tool which is alternative to their existing and cumbersome reporting. Traditional business intelligence solutions are too complex and creates a lot of extra work for the IT department so the company turned to an easy to use and flexible QlikView.

QlikView enables business users to assemble data from multiple sources, explore it, make discoveries, and uncover insights that enable them to solve business problems in new ways. QlikView works the way the mind works. Users conduct searches and interact with dynamic dashboards and analytics from any device. They ask and answer streams of questions on their own and in groups and teams. They forge new paths to insight and decision.

QlikView will connect to existing Teradata, Microsoft (SQL Server), and Oracle datawarehouses which hold all of the data and consolide all of the data sources into a single view, allowing users to quickly and easily track and analyze all of their relevant metrics. The original QlikView deployment was as a management information system, however the organization later chose to expand the solution into their sales organization to perform critical sales analysis. Today, all major KPIs in the sales department are tracked through Helsana’s sales cockpit, powered by QlikView. As an added bonus, Helsana benefits from the synergies of the management information system and sales management now that they are all run on a common platform.

A screenshot from an insurance dashboard running on QlikView platform.
"We wanted a flexible BI solution for standard reporting and ad hoc queries. The key was finding a solution that allowed us to control and analyze live data company wide,” said Harald Roshardt, Head of Analysis & Reporting at Helsana. “QlikView is not only more cost effective than an SAP or IBM Cognos solution would have been, but it also allows us to obtain insights into our current sales activity and analyze the data in seconds. This is all without going through the laborious, manual process we had previously.”

“Helsana is a great example of how the use of QlikView can start in one part of the organization and then spread to other departments to create additional value,” said Chris Christy, National Healthcare Market Director, Qlik. “By enabling business users to manage analytics on their own, QlikView allows organizations to scale their BI deployments in a way that makes sense for their organization, without bogging down the IT department.”

For a detailed overview of QlikView platform, refer to our What is QlikView? QlikView Overview post.

Sunday, September 7, 2014

Insurance Dashboard demo by QlikView Business Intelligence Platform

Insurance data analysis can help all types of insurance firms (including property & casualty, life, health, etc) to improve profitability across the board. But to make it happen, insurance companies also need to have the right tool.

This rare Insurance data analysis dashboard (Insurance dashboard in short) is a business and profitability management application for the insurance industry developed on powerful QlikView Business Intelligence reporting platform. The application covers a range of business areas, and presents a compelling story for how a powerful Business Discovery tool can help companies improve profitability across the board.

This application contains the transaction level details of insurance claims and policies. The sample data is on customers, policies, and claims from a midsize insurance carrier. The dashboard allows its users to analyze this year’s performance based on the number of claims and policies as well as loss ratio. Customer mix is captured using a parallel coordinate chart so users can identify the characteristics of customers and their behaviors.

One of the great extras with this dashboard is that it provides both desktop and mobile sheets so the users who prefer mobile BI can also take advantage of it. The sheets that are presented to the user is determined by the device that is used to analyse the data. A document extension is utilized to detect the device and then this populates a variable to hide or show the relevant sheets.

Below are some screenshots from this great insurance dashboard application which is publicly available.

You can try insurance demo by accessing the free public insurance dashboard demo application. Please fill in the Data Analytics with Qlik Demo/App Request Form so we can send you the link to complete package.

The Insurance Dashboard view (see below) gives users an overview of the Insurance data. Key KPI’s are located across the top of the sheet, along with other key metrics and the performance across the bottom.

Insurance Data Analysis Application Dashboard View

Insurance Policies Analysis –The policies view below provides more details around the policy area of the business. This analysis includes a number of different views of the length of membership and avg premium charts using the cyclic drill button. The sheet also contains a key Triangulation report, common in the Insurance industry. You can also filter the data by a number of key dimensions down the left of the sheet.

Insurance Dashboard Policies Analysis
Other analysis views you can find in the dashboard are Claims Analysis, Loss Ratio Analysis (what if analysis) and Customer Mix analysis.

As we have mentioned above this application also demonstrates mobile bi. It contains an optimized design for small devices such as phones. Access this app using your phone to explore the mobile usability (see below).

Insurance Dashboard Mobile Business Intelligence Screens
Insurance Dashboard Mobile BI Screens

Wednesday, March 5, 2014

QlikView Expense Management Dashboard Demo

Every company has expenses. Every sales or services company has traveling costs. But most expense tools don't give you the insight information about how the expenses were spent. This Expense Management Dashboard application provides you with a way to discover unexpected expenses and track employee spending. With the power of data association, QlikView helps you identify ways to save money for your organization.

QlikView Data Discovery platform is one of the leading business intelligence tools in the market today with agile, intuitive and cost effective structure. You can see a detailed information about QlikView here in our What is QlikView? QlikView Overview post.

QlikView can help  finance users and managers to  analyze large volumes of expense data from disparate sources in a single intuitive expense application.  Business users can freely investigate costs and expenses across multiple geographies, business lines, and systems, to understand detailed spending trends and identify efficiency opportunities. QlikView allows users to eliminate their reliance on end-of-month, high-level static reports, and instead focus on understanding spend activity and taking meaningful action to reduce expenses.

This sample expense management application comes with a Dashboard View, Expense Breakdown View, Employee Expense View and Reports view. Download Expense Management Dashboard package and try it freely on your own. The package includes :

  • Expense Management Dashboard QlikView File (QlikView is required to view it)
  • Expense Management Dashboard Web Link (No installed app is required, just a web browser to use)
  • Expense Management Dashboard executable (You can access demo app without QlikView installed)
  • Expense Management Dashboard video introduction
  • QlikView for Expense Management PDF

The application is structured in a very nice "DAR" Structure. Dashboard - Analysis - Report structure is composed of 3 types of views : high level view for strategic decisions, analysis views for details and reports view for detailed reports.

Expense Management Scorecard

Below is the screenshot from the demo app showing high level Expense Scorecard. This is a typical "Dashboard" level view to show you the current situation at a glance with respect to targets. Color coded alarms and warning icons are used to highlight problems and issues to be looked in more details.


QlikView Expense Management Dashboard
Expense Breakdown Analysis and Employee Expense Analysis

These to analysis views, Expense Breakdown and Employee Expense, analysis allows users to drill down to the details of the expense breakdown. It allows users to dive into individual employee expenses, if needed.

Expense Breakdown Analysis
Employee Expense Analysis

Free access to Expense Management Dashboard

You can try Expense Management Dashboard demo by accessing the free public demo application. Fill in your name, e-mail and phone to the below form and press submit button. You will receive an e-mail links to web based dashboard (you can also access through mobile devices), a self-executable file for you to try it locally (no QlikView license required) and supporting material such as demo video.


Get Acess to Free Copy of Expense Management Dashboard
Name :
E-mail :
Phone :