www.enhencer.com
Turn Data to Profit in Minutes
Predict customer's behavior with the most practical Automated Machine Learning platform.

www.enhencer.com/churn-prediction
Churn Prediction
Focus only on 5% of your customers who are 90% likely to leave.Know who they are and how they behave.Take the right actions to the right customers at the right time by decreasing your marketing costs.

www.enhencer.com/purchase-propensity
Predict Purchase Propensity
Increase the positive return of such campaigns up to 90% and learn why and how the marketing campaigns are made effective against which customer group.

Showing posts with label Business Analytics. Show all posts

Friday, September 7, 2018

Self Service Predictive Analytics and Segmentation - Enhencer


Fast & Powerful Data Analysis

You don't need expensive and complex data science resources to benefit from advanced data analytics. Enhencer enables you to import, analyze and predict in less than few minutes requiring no coding or statistical expertise at all. Enhencer puts the data analysis in a nutshell with 4 steps.

1 - Connect/Upload Data
Upload data of many formats or Import data from various sources like Typeform, Survey Monkey, Google Form and many more in a matter of seconds.

2 - Instant Actionable Insights
Bring down the analysis time from days to minutes as Enhencer empowers the data analysis with decision tree algorithm in an accessible manner for everyone.

3 - Powerful Segmentation
Enhencer is designed with machine learning algorithms that can explore and provide the best & reliable segments automatically no matter the complexity of the data.

4 - Predictive Models
Enhencer builds the perfect predictive model & digs out the variable that truly effects your target automatically leaving you the task of just clicking the predict button.

Predictive analytics segmentation
Advanced data analytics segmentation
Dynamic Data Analytics Features

Enhencer brings all these features together to present the most complete data analysis package featuring from simple & stunning visuals to the most advanced data mining & predictive modeling algorithms. Enhencer also brings machine learning algorithms to the table making the data insights and predictions more accurate and reliable than ever.

Machine Learning Algorithms
Enhencer takes an approach for improving performance and reliability by using machine learning algorithms.

Powerful Segmentation
Enhencer provides powerful & reliable segments automatically from the data using machine learning algorithms.

Stunning Visual Stories
Using intuitive and interactive interface of Enhencer acquire stunning visual stories for all your data types.

Robust Prediction
Predict the unknown using powerful predictive models such as decision tree, random forest, XGBoost & neural network.

Likert & Promoter Score
Survey friendly features to spot the business growth opportunities that no other data analysis packages provide.

Flexible Integrations
Connect and integrate the different data sources from online data collection platforms and database platforms.

sssss


For more information, demo-request or free trial, please click.


Friday, April 20, 2018

Self-service predictive visual data analytics

You are invited to Enhencer Predictive Visual Storytelling webinar on May 4th 2018 at 10:00 AM GMT +8:00.

In this free event, you will discover how self-service visual data analytics can help you to derive actionable insight from data with no data science experience. Enhencer self-service visual predictive platform achieves this by selecting and running the best ready-made machine learning algorithm as you explore your data by click on the visual dashboard. This helps companies to;
  • to free business users from data scientists and perform advanced data analytics
  • to reduce the data analytics time to minutes from days
  • to reduce dependency on expensive data scientist resources and statistical tool
  • increases the use of data analytic so value extracted from data analytics is increased
You will also have a chance to see a demonstrations of Enhencer. Please click register to join.


Event Information

Date :May 4th 2018, 

Time
10:00 – 10:45 AM GMT (Singapore / Malaysia / Hong Kong)
09:00 – 09:45 AM GMT (Indonesia / Thailand)


Tuesday, August 1, 2017

Big Data Analytics in real-time with EXASOL and Tableau webinar

If you are using Tableau’s great BI, reporting and visualization software to see and understand your data, but are struggling with performance or just want to overcome the limitations of Tableau Data Extracts (TDE), EXASOL is the solution you need. Using EXASOL as the analytic database engine to power your Tableau server and client, means that you will be able to accelerate your reporting and visualizations dramatically by boosting your Tableau performance.

EXASOL is the world’s fastest in-memory, high-performance (Massive Parallel Processing or MPP), analytic database which is designed for big data analytics. EXASOL makes large volumes of data analysis in real-time possible, which helps you to accelerate your Business Intelligence and Analytics applications. EXASOL is ideally suited for real-time big data reporting, analysis, and advanced analytics.

EXASOL also enables in database analytics. It supports R, Python, Java, Lua or your preferred programming language to build analytic applications to unearth key insights.


Event Information:
Venue : Webinar (details will be provided after registration)
Dates / Times : You can select any of the 2 time-slots below:
August 4th 2017 10:00 – 11:00 AM Singapore Time
August 18th 2017 10:00 – 11:00 PM Singapore Time

About Infolytics Global

The founders of Infolytics Global Pte Ltd (Infolytics) have experience in providing Big Data Analytics and Data Visualization solutions for all sizes of companies for over 15 years. With our vast knowledge and experience in Data Warehousing and Business Intelligence we have the capability for being the “go to” company for BI solutions. Our expertise is on delivering insights using data visualisation and Big Data Analytics.

We have vast experience in end to end project management of leading BI software like Tableau, QlikView and Qlik Sense. Our team has been part of some of the largest Tableau and QlikView deployments in Asia. One such example is a large semiconductor manufacturing company with more than 3,000 BI users globally. 


Monday, June 19, 2017

What is Exasol?

Data analytics on very large sets of data can be frustrating in terms of performance. Many Business Intelligence applications like Tableau can annoyingly get slow when you are trying to perform real time analysis on large data sets. Solution is usually consolidating and thus reducing the size of the data but this requires extra development and scripts to maintain plus, you lose the granularity of the data.

A good solution to this problem is EXASOL, worlds fastest in-memory, high-performance (Massive Parallel Processing or MPP), analytic database which is designed for big data analytics. EXASOL makes large volumes of data analysis in rel-time possible, which helps you to accelerate your Business Intelligence and Analytics applications. EXASOL is ideally suited for real-time big data reporting, analysis, and advanced analytics.

EXASOL deploys two techniques together : Massive Parallel Processing (MPP) which enables clusters of hardware running EXASOL to achieve the task and in-memory analytics. The database also deploys columnar data compression and storage.

Like a standard RDBMS, EXASOL uses a standard SQL interfaces avoiding the trap of NoSQL skill shortages and easy compatibility with pre-existing applications and data structures.

In below video, you can see how EXASOL can speed up Tableau. The example shows how data residing in two large tables (2.5 billion and 24 billion rows) can be analyzed in Tableau. Tableau has a connector to EXASOL.


EXASOLs in-memory technology enables large amounts of data to be processed in RAM which is significantly faster than processing data residing on hard disk. EXASOL also deploys column-based storage and compression to reduce the number of I/O operations and amount of data needed for processing in main memory and accelerates analytical performance. And Massively Parallel Processing (MPP) enables queries to be distributed across all nodes in a cluster using optimized, parallel algorithms that process data locally in each node’s main memory. The EXASOL intelligent database is self-optimizing and tuning-free. It gives you more time to focus on analytics and insights, not administration.

EXASOL also enables in database analytics. It supports R, Python, Java, Lua or your preferred programming language to build analytic applications to unearth key insights.


Monday, April 13, 2015

Oil and Gas Analytics

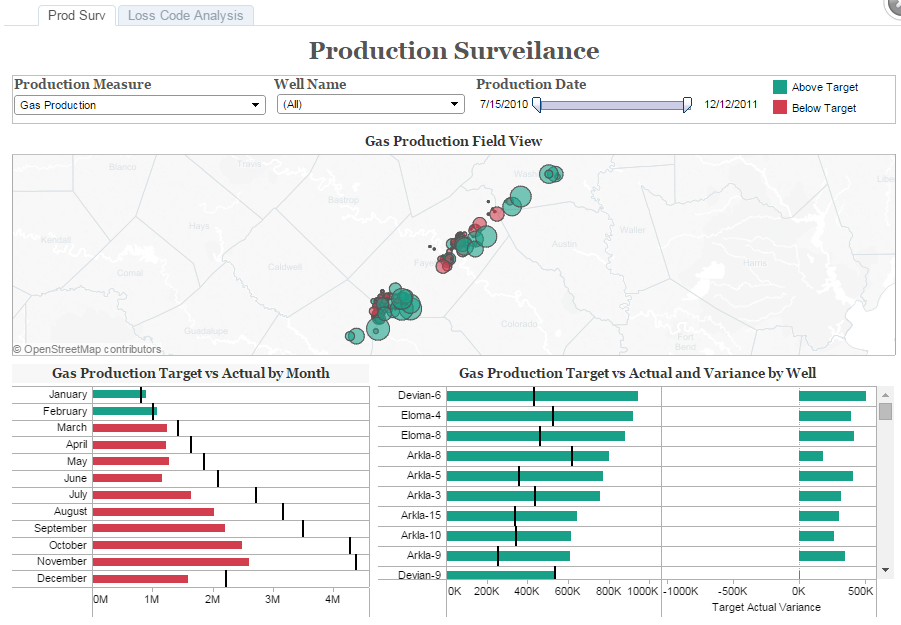
Oil prices shrunk from $115 a barrel to less than $50 a barrel forcing energy firms to reconsider their strategy. Break-even price of producing a barrel of oil needs to be reduced to counter falling prices. Reports have stated that better data analysis could boost production of oil & gas companies by up to 6-8 percent.

There is a whitepaper about Oil and Gas Analytics from Knowledge Management Solutions, a Singapore based Business Intelligence and Analytics solution provider, explains how BI can boost Oil & Gas Industry :
  • Exploration and production analysis
  • Loss code analysis
  • Drilling and Completion analysis
  • Health, Safety, Environment & Security analysis
  • Production Optimization analysis
Oil and Gas Analytics dashboard screen - Production Surveilance
A sample Oil and Gas Analytics dashboard screen - Production Surveilance
You can download the White paper on Interactive Business Intelligence for Oil & Gas Industry.


Wednesday, February 25, 2015

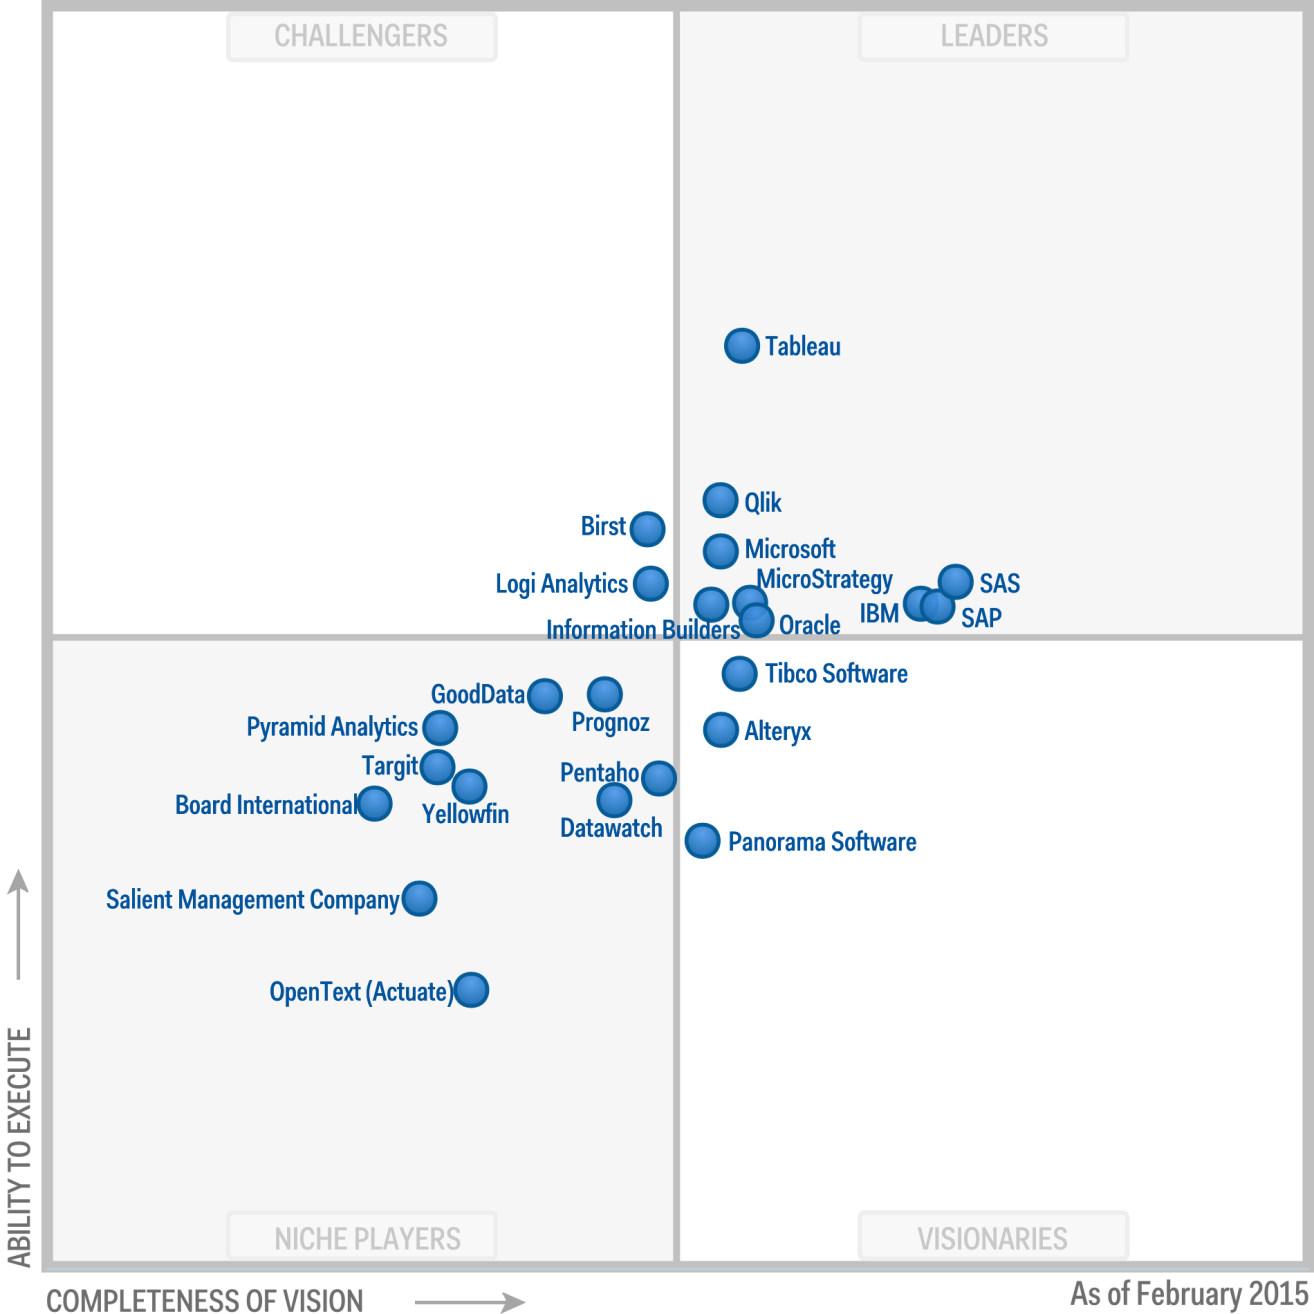
Gartner Magic Quadrant for Business Intelligence and Analytics Platforms 2015

Gartner's infamous Magic Quadrant for Business Intelligence and Analytics Platforms for 2015 has just been released. You can see the quadrant below. We will write about it a little later.

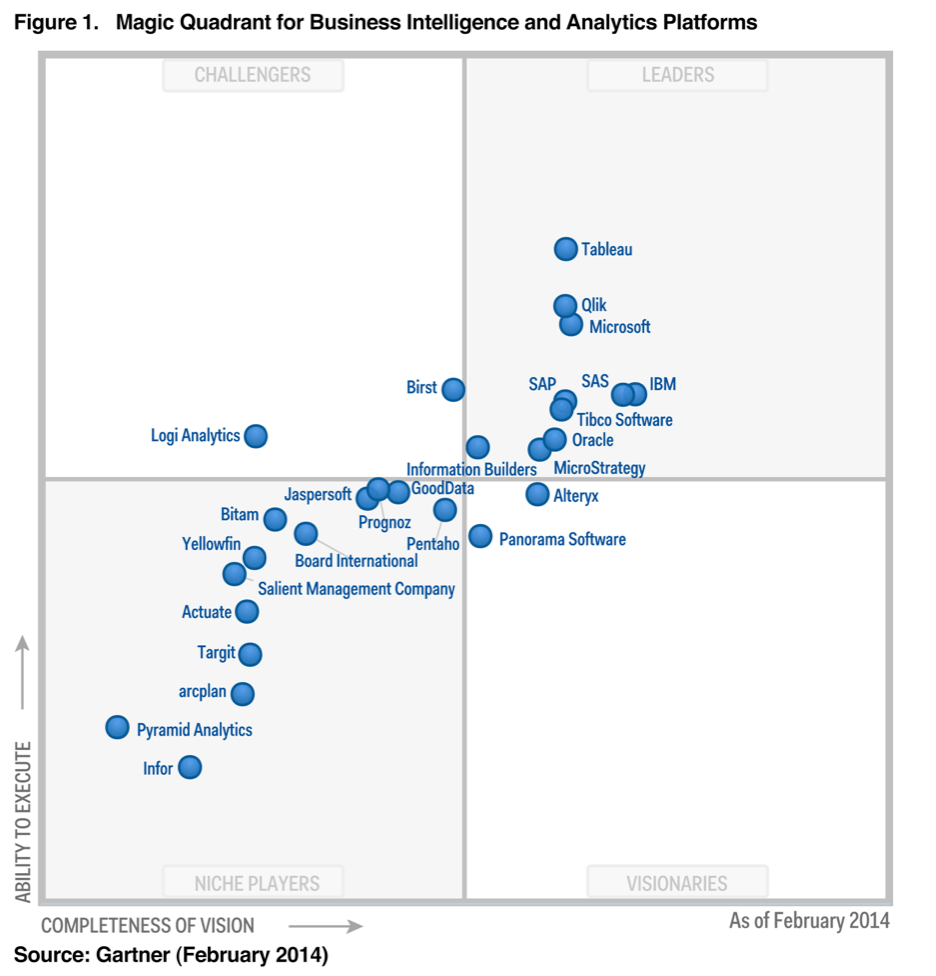
Also compare it with Magic Quadrant of 2014 (see below).

For now some notes :


  • Tableau's stellar rise to leaders quadrant and now becoming the outliner performing better than all others is much more pronounced now in 2015. And this is still before the exiting new release of Version 9. Gartner says "Tableau has clearly defined the market in terms of data discovery, with a focus on "helping people see and understand their data." It is currently the perceived market leader with most vendors viewing Tableau as the competitor they most want to be like and to beat. At a minimum, they want to stop the encroachment of Tableau into their customer accounts."
  • Tibco Software fell from leaders to visionaries. Gartner says "The future of Tibco itself is uncertain, following the acquisition of the company by Vista Equity Partners (which closed in December 2014). In the near term, Tibco will operate as a privately held single entity, as it did when it was publicly traded, but the longer-term intentions of Vista are not yet clear. The ingredients for a leading BI and analytics platform are present with Tibco's many strategic acquisitions; however, Vista will need to implement major changes to address the sales model and execution issues, which have plagued Tibco historically, in order to regain traction and once again be recognized as a market leader."
  • Logi Analytics is moving closer to leaders quadrant. 


Gartner Magic Quadrant for Business Intelligence 2015

Gartner Magic Quadrant for Business Intelligence 2015

Wednesday, September 17, 2014

What is Qlik Sense?

Qlik Sense is a next-generation self-service data visualization application from Qlik, a leading data discovery platform provider. Launched on September 17th 2014, Qlik Sense empowers everyone to easily create a range of flexible, interactive visualizations that drive exploration and discovery through intuition.

Qlik Sense is a new product and is not QlikView 12. So now basically Qlik offers two BI platforms: Qlik Sense and QlikView. You can read more about the difference between Qlik Sense and Qlik View : Qlik Sense vs Qlik View.

Qlik Sense is built on the QIX Associative Data Indexing engine, the second generation of Qlik’s proven and patented engine technology. Associative Data Indexing allows people to explore data relationships across many sources that would otherwise be hidden in hierarchical or query-based approaches. Qlik Sense drives faster time to insight with intuitive exploration, smart search, and smart visualizations. It broadens knowledge sharing with data storytelling and mobility. And, it promotes accuracy and reliability through enterprise governance capabilities that make it truly world class. Qlik Sense brings out the business analyst in everyone, taking self-service to a new level of power and flexibility, so that businesses are more informed and capable of acting and reacting faster.

Qlik built Qlik Sense to deliver broad value to everyone in an organization, whether working individually, in teams, or globally. With Qlik Sense, users of all types and skill levels get the most flexible, modern solution for self-service data visualization and exploration. And, IT organizations no longer have to trade governance and performance to provide it. Whether simply consuming, exploring and analyzing, creating visualizations, or collaborating – Qlik Sense provides advanced capabilities that delight and empower everyone.

Qlik Sense Overview Video

Associative Data Indexing

The QIX (Qlik Index) engine is the second generation of the proven and patented engine technology that has powered Qlik products for the last decade. It provides associative data indexing and dynamic calculation that empower people to naturally explore using their intuition. Associative data indexing exposes relationships in complex, multi-source data sets that would otherwise be hidden in  hierarchical or query-based approaches. Users benefit from this feedback every time they make selection or search, allowing them to gain understanding and take next steps.

Self-Service Visualization and Discovery

Qlik® Sense offers a cutting edge visualization and discovery experience in a smart, responsive, HTML5 client that allows people to quickly explore information and gain critical insights. Qlik Sense is built to promote the use of human intuition in all areas of the user experience.

Intuitive Exploration and Discovery

Exploration in Qlik Sense is unmatched. People can ask questions anywhere using simple, natural interactions such as selection and search, without restrictions or boundaries. The QIX engine instantly responds after each click, recalculating all analytics and revealing data relationships through easy to understand color cues – green (selected), white (associated), and gray (unrelated). This empowers users to follow their own paths to uncover insights and blind spots across many data sources that would otherwise have been overlooked.

Global Smart Search allows users to search the entire data set using keywords to uncover insights and relationships. Qlik Sense automatically displays the dimensions where the desired values match. And, if multiple values are entered, Qlik Sense will reveal not only the matching dimensions but also the relationships that exist between the values, ranking the results by the strength of the associations. This provides immediate insight regardless of where information is located.

Smart Visualizations

Smart visualizations in Qlik® Sense offer new, innovative techniques for conveying meaning in data. They feature advanced summarization of information, intelligent use of color gradients, and responsive design that adapts information based on screen size. And, because visualizations are automatically integrated with the QIX engine, they are fully interactive and respond to changes in context from anywhere in the app.

User Driven Creation

With Qlik Sense, everyone becomes a business analyst. People no longer have to wait for reports or changes to analysis. They can simply drag and drop to create – without having to wire objects together or write complex SQL queries. Creation in Qlik Sense is progressive; people only get the level of sophistication they want and need. Governed, centralized libraries of data, metrics, and objects facilitate sharing and re-use and promote consistency and accuracy. And, users can quickly load and combine their own data from multiple sources without the need for scripting.

Sharing of Knowledge and Insights

Qlik® Sense is built for people and place, allowing users to share analyses and insights, and work collaboratively in both office and mobile settings.

Collaboration and Communication

Groups and teams can easily collaborate in Qlik Sense to make better decisions. A centralized information hub offers streams of content for different topic areas or workgroups, allowing people to locate valuable content fast, or share relevant analyses for others to use, in an organized controlled manner.

Interactive Data Storytelling allows people to use analytics to create and present guided stories, rich with narrative and graphics, to communicate insights and facilitate discussion. Multiple stories can be created to offer different points of view. And direct, in-context access to live analysis allows for immediate answers to follow-up questions that arise, reducing delays in decision making.

Anywhere, Anytime Mobility

Qlik Sense is inherently mobile, built from the ground up for mobility. Users get full capabilities on any device, including exploration, analysis, creation, and collaboration. A unified, touch based HTML5 client provides intuitive operation, and responsive design intelligently adapts visualizations, data, and functionality to create the best possible experience on any device. With Qlik Sense, people can instantly solve problems anywhere, anytime they arise.

Broad Adoption and Organizational Intelligence

Qlik® Sense offers developers and IT administrators the ideal set of approaches to build, deploy, and govern information and analytics environments. And it does this while ensuring business users retain the flexibility and self-service agility they need.

Customization, Extension, and Data Integration

Qlik Sense can be fully customized to meet unique business needs, offering a complete set of open and standard API’s for building rich analytic apps, embedding visualizations into existing solutions, and extending the functionality of Qlik Sense for new types of visualizations and objects. And these capabilities can be utilized by developers with standard technology skill sets such as HTML5, JavaScript, and .NET.

Qlik Sense offers robust data integration, allowing organizations to cleanse, transform, and unify multiple disparate data sources without requiring external tools or data repositories. Qlik Sense can connect to and combine virtually any data source, including spreadsheets, databases, operational systems, ERP, and web sources. And with Direct Discovery, resident big data sources such as Hadoop, Teradata, and Cloudera can be integrated without requiring data to be loaded into memory.

Enterprise-Class Governance and Performance

With Qlik Sense, organizations benefit from enterprise capabilities not seen in standalone visualization tools. This allows organizations to offer the flexibility of self-service discovery without having to trade-off management, governance, security, or scalability.

The Qlik Management Console (QMC) offers a central point of management and monitoring for all areas of Qlik Sense, including multi-geography deployments. The QMC provides a large set of configuration options for content and resources that drive quicker deployments, efficient and flexible license management, and proper use of applications, objects, and data. It’s web based, responsive, and touch enabled for access on any device.

Qlik® Sense offers a centralized, flexible rules-based security model which provides customized, robust protection for all areas of the product. Administrators can define security rules based on users, actions, resources, and the environment, for all areas of the product. Governed, centralized libraries help to ensure consistency and accuracy of data and analytics across the organization. And dynamic data reduction provides granular control over information access down to the row and column level.

Qlik Sense is built using an elastic scaling architecture that allows for seamless deployment and expansion across geographies. It includes a Deployment Management Console that allows for rapid setup and management of local and cloud environments to support greater capacity and performance. And with the QIX engine at its core, Qlik Sense scales to high numbers of concurrent users and large data sets, offering industry leading high-speed dynamic calculation and performance.

Qlik Sense Pricing

Qlik Sense is available from 17th September 2014. Qlik Sense pricing is also completely overhauled : Qlik has also introduced a new, more flexible token-based licensing model for Qlik Sense to provide greater flexibility for license management. Qlik Sense tokens can be allocated to named users, or leveraged across multiple login sessions for one or more users. With the token-based licensing model, customers can deploy multiple servers, across multiple geographies, to optimize for performance and availability without paying any additional costs.

Monday, September 8, 2014

Transport data analytics collaboration of ST Electronics and IBM Singapore

Singapore Technologies Electronics (ST Electronics) and IBM Singapore has announced that they have signed a Memorandum of Understanding  to collaborate on transport data analytics and to exchange technical information about products and capabilities, specifically on the use of smart analytics for urban mobility.

With transport data analytics, governments and companies can better understand the commuting patterns and can optimize the traffic and transportation systems. But since the input data for the transport analytics would be huge and the mathematical foundation of the problem is very complex, powerful platforms as well as expert skills are needed to utilize the analytics.

"IBM is working with organisations around the world to make cities smarter with data driven solutions to attain new levels of insight and efficiency through analytics" said Janet Ang, Managing Director, IBM Singapore. "Our collaboration with ST Electronics (Info-Comm Systems) leverages on IBM’s global expertise in transport data analytics. Through our involvement in existing projects with clients in Singapore, we hope to extend this partnership globally."

IBM Singapore has announced a collaboration with the Land Transport Authority (LTA), SMRT and StarHub to apply fusion analytics to create a state-of-the-art public transport system. The collaboration, announced  on June 2, has been named Fusion AnalyticS for public Transport Emergency Response, or FASTER. It will use data-driven analytic models for better crowd management and public transport incident management.


"This partnership provides an excellent opportunity to leverage ST Electronics’ expertise and proven transport solutions, and IBM’s strength in smart transport analytics products and solutions" LEE said Fook Sun, President, ST Electronics. "Transport data analytics will allow us to better understand commuting patterns in the development and support of a strong data-driven transport infrastructure, with the view to building smarter applications for optimal traffic management and enhancing the travelling experience for commuters."

Monday, August 18, 2014

Introduction to Data Visualization with Tableau 8.2

If you are interested in Business Intelligence and Data Visualization tools and want to have a hands on experience with these software, then do not miss this Tableau learning session in Singapore by Knowledge Management Solutions (KMS). KMS, a Singapore based business intelligence and data visualization solution provider, runs a half a day free Tableau software training session named Build Your First Data Visualization Dashboard in half-day.

Tableau software is one of the most popular and best (according to Gartner Magic Quadrant for Business Intelligence and Analytics Platforms 2014 report) data visualization tools in the market today. Tableau allows anyone to connect to data in a few clicks, then visualize and create interactive, sharable dashboards with a few more. It's easy enough that any Excel user can learn it, but powerful enough to satisfy even the most complex analytical problems. Securely sharing your findings with others only takes seconds. The result is BI software that you can trust to actually deliver answers to the people that need them.

The next session will be on November 27th 2014.

Tableau Training in Singapore
Tableau 8.2 is recenly released with a lot of new features.
Who should attend?
Business people, General Managers, Analysts, Operations Managers, IT Managers, HR Managers, Finance Managers, Marketing Managers, Sales Managers, Service Managers, etc.

What you will learn during the hands-on session:
You will build your first Tableau Business Intelligence Dashboard.

This training will be provided by our key consultants who on average have more than 15 years of experience in Business Intelligence and Analytics.

Seats are limited hence we encourage you to register early to secure your seat(s).

Date:  
27th November 2014
Time:
10 am to 2 pm (registration starts at 9:45 am)
Venue:  
Wheelock Place 501 Orchard Road, #19-01/02. Singapore 238880

This training will be provided by key KMS consultants who on average have more than 8 years of experience in Business Intelligence and Analytics. Seats are limited hence if you are interested, follow the link and register : KMS Data Visualization training in Singapore using Tableau.


Monday, March 10, 2014

Do you need Business Intelligence? No thanks, we are too busy.


Do you need Business Intelligence? No thanks, we are soo busy.

Wednesday, March 5, 2014

QlikView Expense Management Dashboard Demo

Every company has expenses. Every sales or services company has traveling costs. But most expense tools don't give you the insight information about how the expenses were spent. This Expense Management Dashboard application provides you with a way to discover unexpected expenses and track employee spending. With the power of data association, QlikView helps you identify ways to save money for your organization.

QlikView Data Discovery platform is one of the leading business intelligence tools in the market today with agile, intuitive and cost effective structure. You can see a detailed information about QlikView here in our What is QlikView? QlikView Overview post.

QlikView can help  finance users and managers to  analyze large volumes of expense data from disparate sources in a single intuitive expense application.  Business users can freely investigate costs and expenses across multiple geographies, business lines, and systems, to understand detailed spending trends and identify efficiency opportunities. QlikView allows users to eliminate their reliance on end-of-month, high-level static reports, and instead focus on understanding spend activity and taking meaningful action to reduce expenses.

This sample expense management application comes with a Dashboard View, Expense Breakdown View, Employee Expense View and Reports view. Download Expense Management Dashboard package and try it freely on your own. The package includes :

  • Expense Management Dashboard QlikView File (QlikView is required to view it)
  • Expense Management Dashboard Web Link (No installed app is required, just a web browser to use)
  • Expense Management Dashboard executable (You can access demo app without QlikView installed)
  • Expense Management Dashboard video introduction
  • QlikView for Expense Management PDF

The application is structured in a very nice "DAR" Structure. Dashboard - Analysis - Report structure is composed of 3 types of views : high level view for strategic decisions, analysis views for details and reports view for detailed reports.

Expense Management Scorecard

Below is the screenshot from the demo app showing high level Expense Scorecard. This is a typical "Dashboard" level view to show you the current situation at a glance with respect to targets. Color coded alarms and warning icons are used to highlight problems and issues to be looked in more details.


QlikView Expense Management Dashboard
Expense Breakdown Analysis and Employee Expense Analysis

These to analysis views, Expense Breakdown and Employee Expense, analysis allows users to drill down to the details of the expense breakdown. It allows users to dive into individual employee expenses, if needed.

Expense Breakdown Analysis
Employee Expense Analysis

Free access to Expense Management Dashboard

You can try Expense Management Dashboard demo by accessing the free public demo application. Fill in your name, e-mail and phone to the below form and press submit button. You will receive an e-mail links to web based dashboard (you can also access through mobile devices), a self-executable file for you to try it locally (no QlikView license required) and supporting material such as demo video.


Get Acess to Free Copy of Expense Management Dashboard
Name :
E-mail :
Phone :

Monday, February 24, 2014

Magic Quadrant for Business Intelligence and Analytics Platforms 2014

American information technology research and advisory firm Gartner’s Magic Quadrant for Business Intelligence and Analytics Platforms is a highly respected ranking of Business Intelligence and Analytics players. In Magic Quadrant for Business Intelligence and Analytics Platforms 2014 (you can access full report from here), the leaders quadrant, which houses top players in terms of ability to execute and completeness of vision, is now crowded with Tableau, Qlik (QlikTech which has re-branded itself), Microsoft, SAP, SAS, IBM, Tibco Sportfire, Oracle, Information Builders and Microstrategy.

Tableau, which has entered the leaders quadrant just in 2013, is now the best BI/BA platform in terms of ability to execute, clearly highest scoring leader in terms of ability to execute.

There are two challengers in 2014, Birst and Logi Analytics (formerly LogiXML). Although Logi Analytics seem to go down in both ability to execute and completeness of vision, Birst is now almost in the leader’s quadrant.

Each year, Gartner analyzes every vendor in the Business Intelligence and Analytics market. Their research has particular significance because it often identifies the innovations that drive the market. As part of that report, Gartner also releases the Magic Quadrant, which shows the relative positions of the market’s competitors. The trends and innovations that Gartner has identified this year are familiar ones.

Gartner Magic Quadrant for Business Intelligence and Analytics Platforms 2014
Tableau’s popularity is reflected in its Wall Street highflyer profile. Tableau’s year-over-year revenue growth has spiraled upward 62%, 71%, 90% and 95% in the last four quarters.

Here is a summary of what happens in Business Intelligence platform domain based on Gartner’s report:

The broad shift to the left is tied to the years-long ascendance of data-discovery platforms from the likes of Tableau Software, QlikTech, and Tibco Spotfire. Data discovery is now driving the majority of new software license revenue, but these platforms tend to lack “the necessary features in relation to governance, administration, and scalability,” Gartner reports. 
Meanwhile, incumbents like IBM, SAP, Oracle, and MicroStrategy that tend to do well on governance, administration, and scalability have had “limited success in delivering ‘good enough’ data discovery capabilities,” Gartner writes. In other words, practitioners want and need the ease and speed of data-discovery platforms, but they shouldn’t have to give up admin control and the assurance of data-modeling and data-quality consistency across high-scale deployments.
Source : Gartner BI Magic Quadrant: Winners & Losers

Saturday, February 8, 2014

Business users interested in more complex problems of Business Analytics

Business users are interested in more complex problems in the domain of Business Analytics and Business Intelligence according to survey compiled in large meetups targeting business analysts and business intelligence users. Among 5,000 participants almost half are interested in big data and data analytics. Interest in data visualization popularized by Qlikview and Tableau is 29%. 2 more sophisticated Business Analytics topics, data mining (25%) and predictive analytics (23%) are also in the top 10.

You can read more here at Business Analysts Want Access To Advanced Analytics.


Wednesday, January 29, 2014

Reporting vs. Analysis and QlikView

This post is moved to Reporting vs. Analysis and QlikView post in Business Intelligence and Beyond blog.


Reporting vs. Analysis
Reporting versus Analytics
Photo : Adobe Digital Marketing Blog

Tuesday, January 21, 2014

Singapore hospital uses analytics to cut hospital readmissions

Khoo Teck Puat Hospital (KTPH), a 550-bed hospital in Singapore, is using analytics to cut unnecessary readmissions which wastes hospital bed capacity and creates unnecessary cost:
"To further reduce unnecessary readmissions, KTPH recently identified a group of 800 patients with two hospital admissions in a six-month period. Using an analytics technology, doctors were able to target specific patients who were most likely to be readmitted for a third time in the following month.

“This allowed our nurses to prioritise their home visits for more vulnerable patients,” said Mr Lau. He added that the pilot project achieved results of over 90 per cent accuracy. There are currently 800 patients in KTPH’s AIP programme, which does not require additional payment by patients. Mr Lau said that, with timely intervention, the hospital can potentially free up to 58 beds in a six-month period."
Source : KTPH project cuts hospital readmissions
KTPH’s Ageing-in-Place (AIP) programme is an initiative which identifies and offers assistance to patients with a history of frequent readmissions.


Khoo Teck Puat Hospital (Chinese: 邱德拔医院; Malay: Hospital Khoo Teck Puat) is a 550-bed hospital located at Yishun in Singapore. The hospital was officially opened on 15 November 2010, but began seeing outpatients and day surgery patients on 28 March 2010. It is named after late Singapore banker and hotel owner Tan Sri Khoo Teck Puat.

Monday, January 13, 2014

Business Intelligence vs. Business Analytics

Business Analytics (BA) and Business Intelligence (BI) are usually used used interchangeably but there are some key differences between these two and Business Analytics is not Business Intelligence!

Business analytics makes extensive use of data, statistical and quantitative analysis, explanatory and predictive modeling, and fact-based management to drive decision making. Analytics may be used as input for human decisions or may drive fully automated decisions. On the other hand Business intelligence is more about querying, reporting, OLAP, and "alerts".

In this sense, most business intelligence / business analytics tools in the market offers a mix of BA and BI. Some are more BA tool than BI tool and some are more BI tool than BA tool.

Below image shows the Business Analytics levels. There are 2 main level: Reactive decision making and Proactive decision making. And Business Analytics is a term which should be used for proactive  decision making, which is predicting the future. So from bottom up the tools you have (in the order of increasing competitive advantage and degree of intelligence):


Business Intelligence vs. Business Analytics
 Standard Reporting - What happened?
Ad Hoc Reports - How many, how often, where?
Query Drilldown - Where exactly is the problem?
Alerts - What actions are needed?
Statistical Analysis - What is happening?
Forecasting - What will happen next?
Predictive Analysis - What is the best that can happen?
Optimization - Lets' act on it.