www.enhencer.com
Turn Data to Profit in Minutes
Predict customer's behavior with the most practical Automated Machine Learning platform.

www.enhencer.com/churn-prediction
Churn Prediction
Focus only on 5% of your customers who are 90% likely to leave.Know who they are and how they behave.Take the right actions to the right customers at the right time by decreasing your marketing costs.

www.enhencer.com/purchase-propensity
Predict Purchase Propensity
Increase the positive return of such campaigns up to 90% and learn why and how the marketing campaigns are made effective against which customer group.

Showing posts with label Tableau. Show all posts

Tuesday, August 1, 2017

Data Analytics for Online Shops

Making shopping a smooth and easy experience is the goal of many online shops. But how can easy website navigation be optimized? Unlike the physical shops, you cannot talk to the sales people in the online shops and a customer should find his or her way through the online shop. And unlike pysical shops, online shops can have hundreds of thousands of visitors every day.

To optimize the shopping experience, some important questions should be answered :

  • Why do customers put products into their shopping cart and do not buy them at the end?
  • Was it because of the sales process or he/she liked another product simply better?
  • What impact has a customer's drop from a detail page?
  • Where are the differences in customer behavior depending on the different product groups,
  • Customer types or assortments?
  • What are the figures compared to the previous year?
  • Were there any technical errors? Was the accessibility of all pages always guaranteed?

Traditionally, answering these questions require a lot of work and usually takes a few days a month to prepare answers and presentations for the management. Since the process is slow and requires many man-days, most companies cannot perform it anytime they want or in the frequency they need.

German business consultancy company Mayato automatize this process using data preparation, analytics and visualization tools.

The company extracts data from the operational database to in-memory, ultra-fast analytics database named EXASOL. Traditionally, large volumes of data need to be extracted from the database, loaded into R statistical language based scripts and run; and then loaded back to database for analysis and visualization.

Markus Dill, Managing Director at Mayato, explains the importance of good analytics for companies in the manufacturing sector and why having an analytic database that is low-maintenance such as EXASOL is critical for business success.

But EXASOL has built-in R capabilities so R scripts can be run on EXASOLs ultra-fast and high performance analytics environment. The company uses Talend ETL tool for automated data extraction, transformation and load. The data extraction, crunching (using R) and data visualization (in Tableau software) are all automated without human intervention.

The combination of Talend, EXASOL and Tableau fully automated the process and reduced its report generation cycle from days to hours.

Big Data Analytics in real-time with EXASOL and Tableau webinar

If you are using Tableau’s great BI, reporting and visualization software to see and understand your data, but are struggling with performance or just want to overcome the limitations of Tableau Data Extracts (TDE), EXASOL is the solution you need. Using EXASOL as the analytic database engine to power your Tableau server and client, means that you will be able to accelerate your reporting and visualizations dramatically by boosting your Tableau performance.

EXASOL is the world’s fastest in-memory, high-performance (Massive Parallel Processing or MPP), analytic database which is designed for big data analytics. EXASOL makes large volumes of data analysis in real-time possible, which helps you to accelerate your Business Intelligence and Analytics applications. EXASOL is ideally suited for real-time big data reporting, analysis, and advanced analytics.

EXASOL also enables in database analytics. It supports R, Python, Java, Lua or your preferred programming language to build analytic applications to unearth key insights.


Event Information:
Venue : Webinar (details will be provided after registration)
Dates / Times : You can select any of the 2 time-slots below:
August 4th 2017 10:00 – 11:00 AM Singapore Time
August 18th 2017 10:00 – 11:00 PM Singapore Time

About Infolytics Global

The founders of Infolytics Global Pte Ltd (Infolytics) have experience in providing Big Data Analytics and Data Visualization solutions for all sizes of companies for over 15 years. With our vast knowledge and experience in Data Warehousing and Business Intelligence we have the capability for being the “go to” company for BI solutions. Our expertise is on delivering insights using data visualisation and Big Data Analytics.

We have vast experience in end to end project management of leading BI software like Tableau, QlikView and Qlik Sense. Our team has been part of some of the largest Tableau and QlikView deployments in Asia. One such example is a large semiconductor manufacturing company with more than 3,000 BI users globally. 


Monday, June 19, 2017

What is Exasol?

Data analytics on very large sets of data can be frustrating in terms of performance. Many Business Intelligence applications like Tableau can annoyingly get slow when you are trying to perform real time analysis on large data sets. Solution is usually consolidating and thus reducing the size of the data but this requires extra development and scripts to maintain plus, you lose the granularity of the data.

A good solution to this problem is EXASOL, worlds fastest in-memory, high-performance (Massive Parallel Processing or MPP), analytic database which is designed for big data analytics. EXASOL makes large volumes of data analysis in rel-time possible, which helps you to accelerate your Business Intelligence and Analytics applications. EXASOL is ideally suited for real-time big data reporting, analysis, and advanced analytics.

EXASOL deploys two techniques together : Massive Parallel Processing (MPP) which enables clusters of hardware running EXASOL to achieve the task and in-memory analytics. The database also deploys columnar data compression and storage.

Like a standard RDBMS, EXASOL uses a standard SQL interfaces avoiding the trap of NoSQL skill shortages and easy compatibility with pre-existing applications and data structures.

In below video, you can see how EXASOL can speed up Tableau. The example shows how data residing in two large tables (2.5 billion and 24 billion rows) can be analyzed in Tableau. Tableau has a connector to EXASOL.


EXASOLs in-memory technology enables large amounts of data to be processed in RAM which is significantly faster than processing data residing on hard disk. EXASOL also deploys column-based storage and compression to reduce the number of I/O operations and amount of data needed for processing in main memory and accelerates analytical performance. And Massively Parallel Processing (MPP) enables queries to be distributed across all nodes in a cluster using optimized, parallel algorithms that process data locally in each node’s main memory. The EXASOL intelligent database is self-optimizing and tuning-free. It gives you more time to focus on analytics and insights, not administration.

EXASOL also enables in database analytics. It supports R, Python, Java, Lua or your preferred programming language to build analytic applications to unearth key insights.


Monday, June 12, 2017

Dramatically speed up your Tableau visualizations with EXASOL

Tableau is one of the best Business Intelligence and Data Visualization software in the market today. Its game changing drag-and-drop, self-service experience is unparalleled and it is popularly used worldwide.

Tableau is highly optimized and works quite fast in many applications but in applications where you need to read large volumes of data, like hundreds of millions or billions of rows, it can get dramatically slow (yes there are some illustrations of Tableau with large datasets but they are very isolated, single report demos and in a real life dashboard things can get pretty slow if you need to reaf more than 100 million rows).

Tableau is aware of this problem so back in March 2016, they have purchased HyPer, a high performance database system initially developed as a research project at the Technical University of Munich (TUM). Unfortunately, they did not release any plan for the availability of HyPer yet.

Luckily, there is already a solution out there, more established and powerful than HyPer. The solution is Exasol.

EXASOL analytic database management software is currently the fastest, in-memory analytic database in the world. Since 2008 EXASOL led the Transaction Processing Performance Council's TPC-H benchmark for analytical scenarios, in all data volume-based categories 100 GB, 300 GB, 1 TB, 3 TB, 10 TB, 30 TB and 100 TB.

If you are using Tableau’s great BI, reporting and visualization software to see and understand your data, but are struggling with performance, then you need EXASOL. Using EXASOL as the analytic engine to power your Tableau front-end tool means that you will be able to accelerate your reporting and visualizations dramatically.

You can see Exasol in action below. Note that, Tableau already has a native connection to Exasol.


Exasol does one thing and one thing extremely well. Its high-performance, in-memory, MPP database is specifically designed for in-memory analytics. Exasol analytic database achieves lightning-fast performance with linear scalability by combining in-memory technology, columnar compression and storage, and massively parallel processing.

Since 2014, EXASOL has maintained its position as the undisputed leader in TPC-H benchmarks.  From data volumes that range from 100GB right up to 100TB, EXASOL holds the number one position - by a significant margin - over other solutions, for both raw performance and price-performance.
Exasol also offers out-of-the-box support for R, Python, Java and Lua. EXASOL also allows you to integrate the analytics programming language of your choice and use it for in-database analytics. It can easily connect to your existing SQL-based BI, reporting and data integration tools via ODBC, JDBC, .NET as well as a JSON-based web socket API.

Friday, May 19, 2017

Tableau 10 Data Visualization Software Webinar (with Step-by-step demo)

You are invited to Tableau 10 Data Visualization Software webinar on June 9th and June 16th 2017.

In this free event, you will have a chance to learn how a state of the art data visualization platform like Tableau can help you to explore and analyse your data. Thanks to Tableau’s intuitive GUI and drag-and-drop data visualization capabilities, everyone in your organization can easily create flexible, interactive visualizations and make meaningful decisions.

The event will also demonstrate a step-by-step Tableau demo which will show how you can create stunning interactive data analysis dashboards intuitively by just simple drag-and-drop interfaces. You will learn how to explore data with smart visualizations that automatically adapts to the parameters you set — no need for developers, data scientists or designers. We will also cover what are new functionalities in Tableau 10 and Tableau 10.2.

There are 4 date / time slots available for the event.


Tableau Event Information:
Venue : Webinar (details will be provided after registration)

Dates / Times : You can select any of the 4 time-slots below:
  • June 9th 2017 09:00 – 10:00 Singapore Time
  • June 9th 2017 14:00 – 15:00 Singapore Time
  • June 16th 2017 09:00 – 10:00 Singapore Time
  • June 16th 2017 14:00 – 15:00 Singapore Time
Agenda :
- Introduction to Tableau Data Visualization
- Tableau Data Visualization Features
- Tableau 10.2 Demo

This event is conducted by Infolytics Global. 

The founders of Infolytics Global Pte Ltd (Infolytics) have experience in providing Big Data Analytics and Data Visualization solutions for all sizes of companies for over 15 years. With our vast knowledge and experience in Data Warehousing and Business Intelligence we have the capability for being the “go to” company for BI solutions. Our expertise is on delivering insights using data visualization and Big Data Analytics.

We have vast experience in end to end project management of leading BI software like QlikView, Qlik Sense and Tableau. Our team has been part of some of the largest QlikView and Tableau deployments in Asia. One such example is a large semiconductor manufacturing company with more than 3,000 BI users globally.

http://infolyticsglobal.com

Thursday, April 27, 2017

Qlikview to Tableau Migration

Tableau is one of the most popular Business Intelligence software in the market today. Many organizations are adapting Tableau recently and trying to migrate from their old Business Intelligence platform to Tableau. In this post, we will focus on QlikView to Tableau migration.

Effort needed to migrate from QlikView to Tableau depends on the way your QlikView software is implemented. In some cases, the data needed for QlikView Dashboard is completely prepared in a 3rd party tool so when migrating to Tableau, you do not need to convert ETL (extraction - transformation - load) code. But in most cases, ETL for QlikView is implemented using Qlik's own query language, AQL (QlikView is based upon patented technology called Associative Query Logic (AQL)).

Tableau does not provide a native ETL functionality so when migrating from QlikView to Tableau, you will probably need a 3rd solution to implement ETL for Tableau.

The exception above is of course keeping QlikView for ETL and just converting QlikView in-memory data to Tableau's native data set, TDE. But this usually involves, keeping two software licenses under maintenance.
Qlikview to Tableau Migration
QlikView to Tableau Migration
So usually, Qlikview to Tableau migration requires :
1 - Selecting an ETL tool to migrate QlikView AQL code to
2 - Migrating QlikView AQL code to new ETL logic
3 - Reimplementing the dashboards

Yes, there is no product/tool that does automatic migration from Qlikview to Tableau dashboards. You need to manually implement the dashboards in Tableau. Traditionally, QlikView scripting language is richer than Tableau's own expression language so you will also need to handle some in dashboard calculations in ETL when migrating to Tableau.

Though looks difficult, the task is achievable, especially if you outsource the Qlikview to Tableau migration work to a company who knows both QlikView and Tableau. Here is one such company.

Monday, April 24, 2017

Tableau Data Integration

Tableau may be a great data visualization tool but it has very limited functionality for data blending and data integration. Worse, most customers misunderstand "self service business intelligence concept" and think that they will get Tableau and without any data integration they can connect to the databases and create visualization (customers are actually made to believe this with Tableau's sales pitch).

Unfortunately, most business data is stored in complex relational database management systems or ERP which is very difficult, if not impossible to connect directly. Thus, many companies buying self service business intelligence solution realize that they cannot use it effectively due to this limitation.

Solution for this Tableau data integration problem is developing a  data integration with a non-Tableau application which is purpose built for this function. This data integration layer will simplify, consolidate and usually enrich the complex transactional data and will make it available for business users to easily develop visualizations. It will also transfer the query load from transactional system to this intermediary stage so the dashboards will also work faster. Such intermediary Tableau data integration layer became more crucial in the big data age.

Since Tableau deploys ease of use of "Drag-and-Drop", ideally the data integration system should also have the same drag-and drop capability and free of scripting. Luckily there are drag-and-drop data integration software out there and some are open source such as Pentaho.

There are drag-and-drop data integration software out there and some are open source such as Pentaho.
You can download Tableau Data Integration Services brochure to find out more : Enterprise Tableau Data Integration and Management Paper.

If you are having problems in Tableau data integration and data management, an expert Tableau services help may be very useful. In this case you should choose a Tableau consultancy firm, which will guide you in the process and implement the actual Tableau data integration layer.

Thursday, April 6, 2017

Tableau subscription pricing model

Tableau Software is finally making the big change in the way it sells its business intelligence products: they have announced their new Tableau subscription pricing for all its products, including Tableau Desktop and Tableau Server. These new pricing model will potentially lower the threshold for users looking to gain access to a full-fledged analytics platform.

Tableau subscription prices are now as below :
  • Tableau Desktop Personal subscription price is US$35 per user per month
  • Tableau Desktop Professional subscription price is $70 per user per month
  • Tableau Server subscription price is US$35 per user per month
  • Tableau Enterprise offerings prices are not public but this is also available under  Tableau subscription model.
Tableau perpetual prices are $1000 for Tableau Desktop Personal, $2000 for Tableau Desktop Professional and $1000 for Tableau Server per user. The perpetual model also comes with 20% yearly license maintenance.

Since Microsoft Power BI entered the market 2 years ago, there is a growing market pressure on Tableau and its rival Qlik to lower the prices or provide flexible subscription models. This new Tableau pricing model is in line with customer demand and industry trends, and will significantly reduce the initial expense of deploying Tableau business intelligence. Under subscription model, customers will also gain full access to frequent product updates without having to purchase a perpetual software license.

“Many customers have told us they prefer to purchase software through a subscription model to more easily access the products they want, reduce upfront expenses and increase flexibility,” said Adam Selipsky, president and CEO of Tableau.

Tableau subscription pricing model
Tableau subscription pricing offers affordable access to one of the best Business Intelligence solution available today.
This move will make it easier for Tableau to compete in a very crowded BI market. Tableau customers surveyed for Gartner’s Magic Quadrant were always happy overall with Tableau software, but they were often frustrated with the company’s rigid pricing policies.

Tableau's rival Qlik has also announced their subscription model this year in January.

Thursday, March 31, 2016

Tableau has acquired HyPer high performance database system

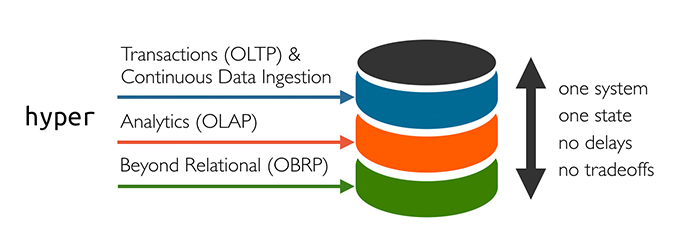
Tableau has announced the acquisition of HyPer, in-memory, high performance database system designed for simultaneous, high performance OLTP and OLAP processing.

Hyper high-performance database system will be integrated into Tableau’s product offerings and bring a host of new capabilities to Tableau customers such as faster analysis of large data sizes, richer analytics, enhanced data integration and data transformation as well as support for semi-structured and unstructured data.

Tableau is highly optimized and works quite fast in many applications but in applications where you need to read large volumes of data, like hundreds of millions or billions of rows, it can get dramatically slow (yes there are some illustrations of Tableau with large datasets but they are very isolated, single report demos and in a real life dashboard things can get pretty slow if you need to reaf more than 100 million rows). There are some other tools also available in the market with native Tableau data connections. Most notable and famous of these is EXASOL in-memory analytic database management software.

Like Tableau, HyPer grew out of a research project. started in 2010 by professors Dr. Thomas Neumann and Dr. Alfons Kemper, chair of at the Technical University of Munich (TUM) Database Group. Four of the project’s Ph.D. students, Tobias Muehlbauer, Wolf Roediger, Viktor Leis and Jan Finis, will join the Tableau family, focused on integrating Hyper into Tableau products.[1]

Here is a detailed definition of Tableau's new HyPer in the project website :

"HyPer is a main-memory-based relational DBMS for mixed OLTP and OLAP workloads. It is a so-called all-in-one New-SQL database system that entirely deviates from classical disk-based DBMS architectures by introducing many innovative ideas including machine code generation for data-centric query processing and multi-version concurrency control, leading to exceptional performance. HyPer’s OLTP throughput is comparable or superior to dedicated transaction processing systems and its OLAP performance matches the best query processing engines — however, HyPer achieves this OLTP and OLAP performance simultaneously on the same database state. Current research focuses on extending HyPer’s functionality beyond OLTP and OLAP processing to exploratory workflows that are deeply integrated into the database kernel by utilizing HyPer’s pioneering compilation infrastructure."[2]

Tableau HyPer high performance database system


[1] - Welcome, Hyper team, to the Tableau community!
[2] - http://hyper-db.com/

Monday, November 30, 2015

Data Visualization by Tableau Introduction in Singapore

If you are looking for a chance to know Tableau data visualization platform in Singapore, Knowledge Management Solutions, a Business Intelligence and Data Visualization solution provider and Tableau partner in Singapore, is offering a half day free Introduction to Data Visualization with Tableau 9

Tableau is a business intelligence and data visualization software platform that allows anyone to connect to data in a few clicks, then visualize and create interactive, shareable dashboards with a few more. It’s easy enough that any Excel user can learn it, but powerful enough to satisfy even the most complex analytical problems. Securely sharing your findings with others only takes seconds. The result is BI software that you can trust to actually deliver answers to the people that need them.

Tableau Singapore event - Introduction to Tableau 9.0
Data Visualization with Tableau in Singapore
Who should attend?
Business people, General Managers, Analysts, Operations Managers, IT Managers, HR Managers, Finance Managers, Marketing Managers, Sales Managers, Service Managers, etc.

What you will learn during the event:
You will witness the self-service Business Intelligence capabilities of Tableau platform as well as different components of the platform.

Seats are limited hence we encourage you to register early to secure your seat(s).

Tableau Event Details
Date : 10th December 2015
Time: 09 am to 12 pm
Venue: South Beach Tower, Level 10, 38 Beach Road, Singapore 189767 (Tableau Software APAC Office)

Agenda:
1.     Introduction to Tableau Business Intelligence and Data Visualization
2.     What is new in Tableau 9
3.     Data extraction from different sources
4.     Data modeling
5.     Building your data visualizations in Tableau
6.     Dashboards and stories

See the details here.

Tuesday, July 14, 2015

Free Tableau Demo in Singapore for manufacturing

Tableau Software has recently released their brand new data visualization platform version, Tableau 9.0 in April and in June officially released the new version in Singapore. If you are keen to try out this mind blowing self-service business intelligence platform, you can download a free Tableau download (14-days trial) and also watch this 23 minute full demo of the platform, Getting Started with Tableau.

For those in Singapore, Knowledge Management Solutions, an official Tableau Software partner based in Singapore (with offices in Kuala Lumpur, Bangkok and Jakarta) is conducting a full 1.5 hour demo of Tableau on 31st July 2015 - 9:30am - 11am in Singapore Management University campus.

You can see the details and form to register here : Tableau for Business Users Event.

This Tableau 9.0 demo for Business Users event is regularly conducted and this session targets manufacturing. Still, it is offers a demo for every one including non-manufacturing industries to experience how Tableau can help them to make sense of their data.

Tableau in Singapore
Tableau for Business Users offers a 1.5 hour Tableau demo in Singapore.

Tuesday, January 6, 2015

Navision Sales Analyzer Dashboard

Navision Sales Analyzer is a Business Intelligence Dashboard for sales which built on the powerful Tableau data visualization platform. Developed by Singapore based Knowledge Management Solutions, it empowers Microsoft Navision users to analyze and visualize data and to make strategic calls about sales and marketing.
  • Plan revenue
  • Analyze the impact of promotions
  • Discover performance of products
  • Compare product market share Vs. market growth
  • Perform market basket analysis
  • See customer buying behaviour clearly
You can watch a video introduction of Navision sales analyzer below. If you would like to find out more, KMS has a free demo event to introduce the product to the market. Click here to join : KMS Navision Sales Analyzer Demo.

Friday, October 24, 2014

What is Tableau Drive?

With skyrocketing revenues and number of 100K USD deals (a gauge showing enterprise adaptation of a business software), Tableau is getting fast into enterprise-wide BI deployment. As the emphasis on "Tableau for Enterprise" was significantly higher in this years Tableau Customer Conference (September 2014), Tableau Software has also released Tableau Drive, a  methodology for scaling out self-service analytics.

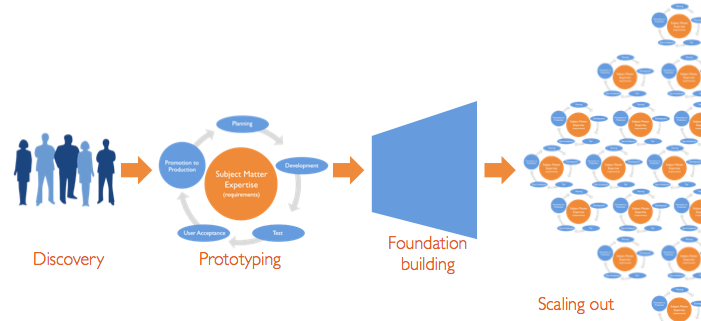
So what is Tableau Drive? This is a freely available methodology relying on iterative, agile methods that are faster and more effective than traditional long-cycle deployment. A cornerstone of this approach is a new model of a partnership between business and IT. In Drive methodology, IT owns the “Center of Operations” and business owns analytics and the “Center of Evangelism”.

Tableau Software released the methodology ahead of Tableau 9.0 which is expected in the first quarter of 2015. Tableau 9.0 is expected to have a lot of improvements in scalability some of which were showcased in September's event.

Drive has 4 phases "Discovery", "Prototyping", "Foundation Building" and "Scaling Out".

The 4 phases of Tableau Drive

Tableau ready for Enterprise BI

Tableau, one of the most popular BI tools in the market today, is truly an amazing and comprehensive platform. Yet, many still think that Tableau just an eye candy toy tool, good for making pretty pictures but not for a serious, enterprise BI level platform. This is absolutely not true (if this was true, Tableau would not be in the leaders quadrant of Magic Quadrant for Business Intelligence and Analytics Platforms 2014).

Tableau offers tremendous efficiency, productivity, flexibility, performance and cost savings. Some discovers this accidentally, they bring Tableau in the project as their personal tool to understand data and then Tableau's highly viral nature carries it into the hearth of enterprise BI. Some innovative project teams head starts enterprise BI with Tableau and usually awarded successful implementations ("usually" because some teams will always have the ability to screw up projects even with great tools). You can see this in numbers. In Q2 2014, there were 157 $100,000-plus deals (a usual KPI to measure enterprise success of BI tools) and the number is increasing fast.

And yet the best part of the story is that Tableau Software, the company developing Tableau, is working hard to make it more enterprise ready in every release.

Tableau 9.0, the upcoming major version release, will most probably carry the product to a much higher level. September 2014's Tableau Customer Conference was the most important indicator of this ground breaking shift : "Tableau for Enterprise BI" was more emphasized compared to previous years. In an interview with InformationWeek, Tableau's VP product management Daniel Jewett, said that they have had a roadmap for how to bring 'analytics at scale' for five years. In the conference of September, Tableau Software also announced a massive update of its data engine that will bring support of parallel queries on machines with multicore processors, resulting in a 4x speed increase, company executives said.

Another gesture of focus for wide-scale enterprise deployments was the introduction of Tableau Drive, an implementation methodology and a set of services. Based on iterative, agile methods that are faster and more effective than traditional long-cycle deployments, Tableau Drive, is freely available.

Tableau is also commercially more effective compared to many competitors out there. Although Tableau server license pricing is not public, I would say it scales up very well without going into "Oh-my-Gosh" region in terms of Dollars.

Monday, October 20, 2014

Data Visualization for Shipping Industry

This powerful white boarding and demo of a Revenue and Profit Analysis of a shipping company is a rare gem which shows how a powerful data visualization plarform (Tableau in this case) can help companies to analyze their data and dig deep into "why"s.

The video is prepared by a Tableau customer in Indonesia, a leading Shipping and Shipyard Company named PT Usda Seroja Jaya, to introduce their new data visualization platform, Tableau, to their users.

The video starts with a white boarding presentation to illustrate how data analytics can help the company to improve decision making process. The second half of the video is a detailed Tableau demo, a rare data analytics demo for shipping industry. The Tableau demo is also a nice self-service BI presentation for this powerful application.

Tableau is business intelligence software that allows anyone to connect to data in a few clicks, then visualize and create interactive, sharable dashboards with a few more. It's easy enough that any Excel user can learn it, but powerful enough to satisfy even the most complex analytical problems. Securely sharing your findings with others only takes seconds.

Wednesday, October 8, 2014

Tableau, Qlikview, TIBCO, SAS, and Oracle gets best business intelligence ratings

Tableau Desktop has been rated as the best business intelligence platform by business software reviews site G2 Crowd users.  Tableau, the long time category winner, was followed by QlikView, TIBCO Spotfire, SAS BI and Oracle BI.

The Grid for Business Intelligence by G2 Crowd rates and profiles business intelligence products. Products shown on the Grid for Business Intelligence have received a minimum of 10 reviews in data gathered by September 19th, 2014. Products are ranked by customer satisfaction (based on user reviews) and market presence (based on market share, vendor size, and social impact) and placed into four categories on the Grid : Leaders, Contenders, Niche and High Performers.

Leaders offer Business Intelligence products that are rated highly by G2 Crowd users and have substantial scale, market share, and global support and service resources. According to G2 Crowd Grid for Business Intelligence, Tableau Desktop, QlikView, TIBCO Sportfire, SAS BI and Oracle BI were leaders in business intelligence domain.

Tableau Desktop received 42 reviews and satisfaction was 99 percent! With market presence score of 61, Tableau overall got a scoring of 80. The second leader, QlikView got 24 reviews and the satisfaction was scores as 85. With market presence score of 54, QlikView got a score of 69. Oracle BI got the highest market presence score but lowest satisfaction in the list.

Other high ranking BI platforms are in contenders category : Business Objects, MicroStrategy, Hyperion. IBM Cognos and TIBCO Jaspersoft.

Birst and Pentaho are listed in Niche category and GoodData BI and Alteryx were High Performers.

G2 Crowd Grid for Business Intelligence Fall 2014
 You can see the details here at Compare Best Business Intelligence Software.

G2 Crowd defines Business Intelligence software as a solution that helps companies gain perspective on their business operations by leveraging data from any internal sources that detail business activity and its results (financial, marketing, operations, etc). The term business intelligence according to G2 Crowd encompasses the process of transforming unstructured business data into standardized reportable datasets and visualizing that into graphs and tables that expose valuable insights into ROI and process best practices. This software often creates automated reports and dashboards that can be deployed to end users, as well as non-technical user interfaces for business users to slice and dice data on their own and preform ad hoc reporting. 

Tuesday, September 30, 2014

Tableau 9.0 release date and overview

Tableau Software has finally released the new version of its benchmark setting data visualization and business intelligence platform, Tableau 9.0 today on April 7th 2015. The new version comes with an entirely new experience for Tableau Server, significant performance improvements, new data preparation features, drag-and-drop analytics, updates to mapping and much more.


Tableau 8 has been a phenomenal success[1] for data visualization and business intelligence platform provider Tableau Software after the release of Tableau 8.3, everybody was waiting for the new version : Tableau 9. Tableau 9 release date is postponed a few times. In Tableau Conference 2013, the expectation was that Tableau 8.1 would be released in fall 2013, Tableau 8.2 in winter 2014 and Tableau 9.0 later in 2014. Tableau 9.0 release date is later pushed to Q1 2015 and in March one more time to April 2015.

But this is a release worth waiting. There are many significant improvements in Tableau 9.0 over Tableau 8.3 which makes already powerful Tableau Software more competitive.

Tableau User Experience Improvements

Ease of use and flawless data analysis process has always been in the core of Tableau and the company is wisely investing more in this core strength with exiting new features. One of the most significant new feature in the front-end is ad-hoc calculations. You can now write expressions directly on the rows and columns shelves or mark cards with a simple double click. You can later drag these ad-hoc calculations to Data Window to make them reusable calculations.

Tableau 9 Review - Ad-Hoc Calculations
Tableau 9 Ad-hoc calculations feature

A new Analytics Pane in Tableau 9 makes common techniques such as reference lines, bands, totals, trend lines and forecasts readily available by a simple drag-and-drop. Another feature related to Tableau's analytics capabilities is Instant Analytics which provides an interactive experience for comparing summary information about subset of marks to all marks in the view.

New level of details calculation is another exiting new feature which allows you to create arbitrary aggregates in charts without complex and cumbersome expressions. For example, with this new feature, you can easily calculate average sale per customer in each time period by a simple, nested Level of Details Calculation (LOD). LOD syntax also allows you to create fixed values not effected by level of detail in the charts.

Data Connection and Preparation Improvements

Tableau 9.0 now supports Kerberos authentication for Microsoft SQL Server, SQL Server Analysis Service and Cloudera Impala. adds data extraction API for Mac OS and offers new and improved data connectors such as SPSS, SAS and R.

Recently, almost every Tableau release adds more data preparation functionality. Tableau 9.0 is not an exception. Tableau now can detect the range of data in MS Excel files, unpivot tables (converts a cross-tab table to straight table), split data in multiple fields.

Tableau 9 Performance Improvements

Tableau data engine, the in-memory analytics database of Tableau platform, was introduced in Tableau 6 and went through performance improvements since than. But Tableau 9 seems the be the biggest jump. In the presentation, a bar-chart aggregated from 173 million rows of data took 0.7 seconds in Tableau 9 compared to  7 seconds performance of Tableau 8.3 (10x faster)!

As this individual query performance is not enough. Tableau 9 data engine also introduces parallel queries concept. If you have a Tableau dashboard with 3 charts and you do something to trigger a query (i.e. filtering dashboard), each chart queries the database one after another in sequence. In the presentation, a 3 chart dashboard took 9.5 seconds to load. In Tableau 9 it takes 1.1 seconds. Not only individual queries are faster, they also run parallel (provided that underlying database supports parallel queries).

And then comes query fusion. Even if you run parallel queries, why to run a the same query twice if two charts in the view has similar queries which can be run once. Tableau Query Fusion looks at the dashboards and finds way to simply the queries into simple queries.

Suppose that you have two sheets in a dashboard : Sum of Rides per Hour and Average Tip per Hour. In Tableau 8.3, these two will fire 2 individual queries (in sequence) to database. But in Tableau 9, because these two has the same level of details, they will be fused into a single query and run fast. A sample run for 173 million rows takes 3.7 seconds in Tableau 8.3 but only 1.7 seconds in Tableau 9 thanks to query fusion.

So Tableau 9 offers faster queries, parallel queries and thanks to Query Fusion, less queries. And thanks to new External Query Catching, it also offers no queries. Tableau 9 will cash queries in server and desktop and run no queries to database if there is no chance there. In an example run, a 3 sheet dashboard running 9.7 seconds in Tableau 8.3 took only 0.2 seconds to run. 50x improvements.

One of the most desired feature for Tableau 9 is visual ETL (Extraction Transformation and Load) functionality for data quality, validation and cleaning (and data modeling if possible).  Tableau 8.2's "visual data window" seems to be the first step to that direction but we will wait and see if this would be a new feature. Although there are very powerful visual ETL tools which can work seamlessly with Tableau such as Alteryx and Clover ETL, it would be nice to see some more features in this domain with Tableau 9.

On the predictive analytics domain, we expect more functionality in Tableau such as more predictive models and control in newly introduced forecasting feature and better integration with R (current Tableau version can do 4 functions passing parameters to R Server).

We will update this post as more information is revealed about Tableau 9.

[1] - Tableau's Building the 'Google for Data'
[2] - Tableau Gives Up Gains: Estimates Rise, Targets Decline, on Upbeat Q1, Forecast
[3] - Tableau Conference 2014 – A Field Report
[4] - Data Visualization with Tableau

Thursday, September 11, 2014

What is Tableau Project Elastic?

Project Elastic is the code name for a new tablet-based product by Tableau Software which was first announced in Tableau Conference 2014. Tableau Elastic Technology is designed specifically with mobile users in mind and aims to help users to ask questions to their data using just their two fingers and making fairly complicated queries, are just a tap, swipe, scroll or pinch away.

Tableau's VP of Mobile, Dave Story, has demonstrated the product in annual Tableau customer conference. What we can see up to now is that Tableau Software is basically building a new iPad app (or tablet app). In the presentation, Dave Story took an email attachment (a data file listing sales information about a local sandwich shop) and opened it in the Tableau Elastic app. The app immediately opens with a view of a chart showing categories of products sold at the shop. As other Tableau user interfaces, Elastic is also "drag-and-drop" based. With taps, swipes and scrolls, you can easily change the dimensions and measures as well as the chart types.

"The idea is going beyond our core audience, which has been business, and reaching out to the consumer. The motivation is what would you do now if you wanted to disrupt or wanted to start over with Tableau." - Dave Story, Tableau Vice President of Mobile

Tableau Elastic release date and pricing is not announced yet. Tableau Software plans to release Elastic as a product at some point in 2015.

You can find more information on Tableau Elastic in its web page, Be-Elastic.

Tableau Project Elastic
A screenshot of Tableau Project Elastic. Taken from Tableau Software web site,

Monday, September 8, 2014

What is new in Tableau 8.2 Release

Tableau 8.2 was released on June 18, 2014 and Tableau 8.2 Tour stop in Singapore was held on Wednesday July 23, 2014. The new release is already in 8.2.2 (released in August 21) and contains a lot of exiting features. The release includes the first-ever Mac OS version of Tableau Desktop, Story Points for interactive, data-driven storytelling, a more visual connection experience with data previews and improved experience in defining data table joins, and updated maps, in addition to enhancements to simplify administration and support of Tableau Server.

Here is a list of major new features in Tableau 8.2.

Tableau Desktop on the Mac
The revolutionary technology of Tableau Desktop now runs natively on the Mac. It’s the full analytics package, built to support high-resolution Retina displays, Mac-specific controls, and also all of your existing Tableau workbooks.

Story Points
One of the most anticipated features of Tableau 8.2, Story Telling lets you create compelling, interactive, data-driven stories. You can assemble sheets and dashboards into a narrative arc that tells the story in your data. You can capture key insights with annotations, highlights and filters. You can also add descriptions to emphasize findings. Make your story interactive to encourage further exploration.

Tableau Story Points
Visual data window
The data connection experience is redesigned in Tableau 8.2. from the ground up. With the new interface, you can connect to multiple tables, add joins with one click, and preview your data to make sure you've got what you need. You can also modify field properties, add data source filters, and extract your data.

Tableau New Visual data window
New map designs
Maps are critical to geographic analysis and have received a major overhaul in Tableau 8.2. This includes new map designs produced in collaboration with Stamen, worldwide detailed levels of zoom, an improved mapping server and support for high DPI displays.

Additional Tableau 8.2. Desktop features

New Excel & Text File Connector – You can connect to Microsoft Excel and text file data sources that are more than 255 columns. The new connectors automatically and more accurately detect data types and support functions, including Count Distinct and Median.

Native Support for Google BigQuery API - The Tableau connection to Google BigQuery now uses the native API from BigQuery, which means you’ll see improved performance and flexibility.
Improved SAP HANA Connector - The SAP HANA connector now supports HANA variables and Input Parameters.

Splunk Connector - Connect to and analyze machine-data in Splunk with the native Splunk connector (originally introduced in Tableau 8.1.4).

You can watch a 20 minute demo of the new Tableau 8.2. below.


New Tableau Server Features in 8.2

Server REST API - Tableau Server now comes with a REST API to help you easily manage and change your server resources programmatically, via HTTP. Use the API to create new sites, add or delete users from sites, and much more.

Disable Web Authoring - On Tableau Server, all web authoring capabilities can be disabled on a per-site basis, providing more administrative flexibility and control.

Simplified Log Access - Now you can download Tableau Server log files directly from the Admin page in your web browser. Key log files are now generated as JSON to be machine-readable.

Change Content Owner - You can now reassign the ownership of any published content to another user on Tableau Server or Tableau Online.

Import and Export Sites - All content within Tableau Server can be exported and imported on a per-site basis. This allows you to back up more efficiently or move content from one Tableau Server instance to another.

Responsive Marks - The web experience of published content has been upgraded to provide faster response times within the browser. When hovering over a mark on a view, the mark will respond immediately.

OAuth Support - Tableau now supports OAuth authentication when connecting to Salesforce, Google Analytics and Google BigQuery. This makes it convenient to connect to these data sources across all your workbooks and data sources. It also adds a layer of security since Tableau does not have to hold your credentials directly.

Tuesday, September 2, 2014

Analyzing Google Analytics data in Tableau

Google Analytics is the  most widely used website statistics service. It provides a great online platform to analyze your web site traffic. Although it provides powerful charts, reports and dashboards to analyze data, if you have needed to use it professionally, you hit its limitations frequently and do the following : Export the Google Analytics data to Excel and try to analyze it there. This manual and tedious process is always needed if you are trying to merge Google Analytics data and some other data in your analysis.

We know that Tableau provides a great data visualization tool and we could leverage its power to analyze Google Analytics data. But to bring the data into Tableau was tedious; you should export it first (to Excel manually or by using Google Analytics API and lots of scripting). Not anymore! With Tableau version 8 onwards, Tableau Software has released Google Analytics connector which makes it quite easy to pull in your Google Analytics data into Tableau. This does not only allow you to create incredibly interactive dashboards to analyze GA data but also allows you to integrate Google Analytics data with some other offline and online data to add great value to your web site analytics effort.

In this short video below, Ellie Fields from Tableau Software, demonstrates how powerful and interactive analytics opportunities Tableau brings to web traffic analysis. In the 3 minutes win Google Analytics challenge, she brings it some data from Google Analytics using the connector and then merges it with some offline data to create an interactive Tableau dashboard.

If you want to try it on your own, you can download Tableau here.

Tableau Google Analytics Connector makes it very easy to create web site traffic analysis dashboard

Tableau can import a Google Analytics extract into the Tableau fast in-memory data engine. This allows you to explore your web data at the speed of thought by easy drag & drop. You can Tableau Server and Tableau Online to build and store multiple small extracts of un-aggregated data. By reusing extracts you don’t have to pull every time from the Google Analytics interface and hit the 500,000 limit per individual per call. Start with a fixed date range and schedule automatic updates.

You can enhance the web-analytics data by Salesforce.com, spreadsheets, databases, cubes, Hadoop, or more. Then you can easily publish securely for your department or entire organization to use. Set permissions for dashboard, workbook, and data-source access by role and group or for individual named users.