www.enhencer.com
Turn Data to Profit in Minutes
Predict customer's behavior with the most practical Automated Machine Learning platform.

www.enhencer.com/churn-prediction
Churn Prediction
Focus only on 5% of your customers who are 90% likely to leave.Know who they are and how they behave.Take the right actions to the right customers at the right time by decreasing your marketing costs.

www.enhencer.com/purchase-propensity
Predict Purchase Propensity
Increase the positive return of such campaigns up to 90% and learn why and how the marketing campaigns are made effective against which customer group.

Showing posts with label Finance Dashboard. Show all posts

Monday, August 17, 2015

Financial Data Analysis by Jedox event in Singapore

Jedox is an Excel based financial planning software. Financial data is often difficult to audit and unreliable because of ineffective controls in Excel. The issues surface in overworked teams, manually reconciling data scattered across multiple systems and countries. Traditional BI/PM software needed specialised technical teams to develop and maintain them. Waterfall implementations meant Finance filled out requirement documents, explained basic finance concepts to the technical team - and then waited for the result. The business process (that Finance was still ultimately responsible for) was no longer under Finance’s control. To manage this, agile companies adopt the Jedox Suite. Jedox gives you unified planning, consolidation and reporting in one intuitive solution.

Knowledge Management Solutions, an authorized Jedox partner in Singapore, is having a free event to introduce this great platform to finance specialists in Singapore at 3pm - 5pm, on 28th August 2015. The address of this free Jedox event is Singapore Management University 60 Stamford road
Singapore, 178900.

For more details and registration, please visit Register for Jedox Finance Data Analysis event. Watch a short video of Jedox below to see the capabilities.

Wednesday, August 5, 2015

Credit Risk Management Dashboard Demo by QlikView Business Intelligence Platform

Business and risk have always been seen to go hand-in-hand and the need for banks to strengthen their risk management framework is vital. Exposing the true risk profile to the users has been a challenging business problem due to multiple data sources and differences in operational processes and metric definitions.

To mitigate this situation, a financial institution should provide a holistic view of the risks faced by the organization at any point in time. When up-to-date information on risks can be analyzed and put at the users fingertips, firms will inevitably find it easier to maximize profit AND reduce risk.

The purpose of the Credit Risk Management demo is to illustrate how QlikView can be used by a
financial institution to manage credit risk. By providing a unified picture to the entire business, QlikView helps everyone have the same, up to date, picture of their risk exposure instead of disparate spreadsheets floating around the business. Credit Risk data is also interesting to the entire Business, not only the Credit Analysts. Are we pricing the products correctly? Are we in compliance with regulations? Should we continue to do business in a specific market or geographic segment? These are all questions that could be asked against Credit Risk data.

QlikView Credit Risk Management Dashboard application is designed to cover the following main analysis areas:
  • Exposure Concentration Analysis (Exposure : The total amount of credit extended to a client by the lending company)
  • Correlation Analysis
  • Probability of Default (PD) Analysis (The likelyhood that a borrower will default on their loans)
  • Exposure Comperison
  • Capital Allocation Modeling
The application allows you to load your own data. If you download the zip file below, you will see a RiskData Excel file in it. You can input your data in this format by simply opening Credit Risk Management Dashboard app and selecting File > Reload.

You can access the application by following the below links:
QlikView Credit Risk Management Dashboard Template online demo
QlikView Credit Risk Management Dashboard QVW file (opens with QlikView)


Friday, October 3, 2014

Asset Management Dashboard Demo by QlikView Business Intelligence Platform

Asset Under Management analysis is an important part of any financial institution in asset management, private banking and wealth management business. The data can be quite huge and data from many different sources need to be combined to get the big picture. Unfortunately, this process is quite manual in many organizations where plain old MS Excel is used  to perform analysis with usually poor results.

We have seen that a powerful business intelligence platform can be leveraged for wealth management, asset management and private banking institutions to increase analyis productivity greatly. But what is developed is usually not public (even dashboard layouts are protected) so you can not see a lot of nice asset management business intelligence dashboards.

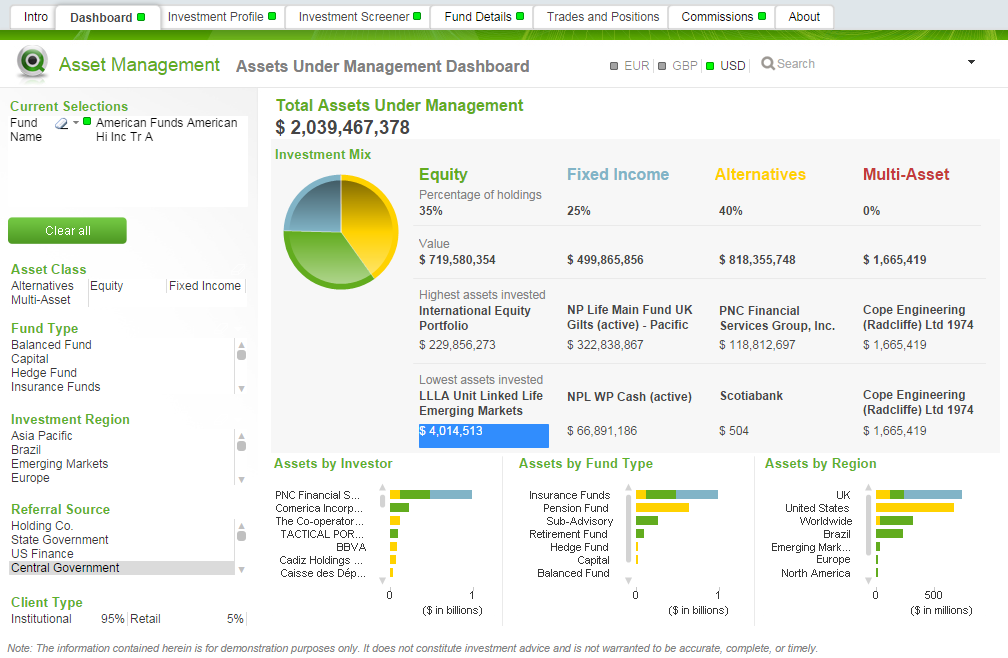
This rare Asset Management demo provides an analysis of assets under management by various dimensions such as asset class, investor, fund type and region. Users can look up funds and their performance and analyze fund details. The source data are from multiple systems such as AUM, Positions, Risk, Returns, Traiding, Portfolio etc. It also contains a capability to look up a group of CUSIPs on finger tips.

The demo application is developed on powerful QlikView Business Intelligence platform which is heavily used in many finance and banking companies.

The Asset Management application contains an Asset Under Management Dashboard to analyze Overall AUM summary by asset class, investor, fund type, as well as region, Investment Profile View, Trades and Positions Analysis View, Investment Screener View (Multiple fund performance and assets under management summary) and Fund Details view where users can access to an Excel-like pivot table ad-hoc analysis of fund details.

In Investment Profile view, when you select a specific fund, you can print the report in PDF with a simple button click.

Asset Under Management Dashboard
Asset Under Management Dashboard Demo

Free access to QlikView Asset Management Dashboard

You can try Asset Management Dashboard demo by accessing the free public demo application. Fill in your name, e-mail and phone to the below form and press submit button. You will receive an e-mail links to web based dashboard (you can also access through mobile devices), a self-executable file for you to try it locally (no QlikView license required) and supporting material such as demo video.

Please fill in Data Analytics with Qlik Demo/App Request Formform (select "Asset Management Dashboard Demo by QlikView Business Intelligence Platform" in dropdown).