www.enhencer.com
Turn Data to Profit in Minutes
Predict customer's behavior with the most practical Automated Machine Learning platform.

www.enhencer.com/churn-prediction
Churn Prediction
Focus only on 5% of your customers who are 90% likely to leave.Know who they are and how they behave.Take the right actions to the right customers at the right time by decreasing your marketing costs.

www.enhencer.com/purchase-propensity
Predict Purchase Propensity
Increase the positive return of such campaigns up to 90% and learn why and how the marketing campaigns are made effective against which customer group.

Friday, October 24, 2014

What is Tableau Drive?

With skyrocketing revenues and number of 100K USD deals (a gauge showing enterprise adaptation of a business software), Tableau is getting fast into enterprise-wide BI deployment. As the emphasis on "Tableau for Enterprise" was significantly higher in this years Tableau Customer Conference (September 2014), Tableau Software has also released Tableau Drive, a  methodology for scaling out self-service analytics.

So what is Tableau Drive? This is a freely available methodology relying on iterative, agile methods that are faster and more effective than traditional long-cycle deployment. A cornerstone of this approach is a new model of a partnership between business and IT. In Drive methodology, IT owns the “Center of Operations” and business owns analytics and the “Center of Evangelism”.

Tableau Software released the methodology ahead of Tableau 9.0 which is expected in the first quarter of 2015. Tableau 9.0 is expected to have a lot of improvements in scalability some of which were showcased in September's event.

Drive has 4 phases "Discovery", "Prototyping", "Foundation Building" and "Scaling Out".

The 4 phases of Tableau Drive

Tableau ready for Enterprise BI

Tableau, one of the most popular BI tools in the market today, is truly an amazing and comprehensive platform. Yet, many still think that Tableau just an eye candy toy tool, good for making pretty pictures but not for a serious, enterprise BI level platform. This is absolutely not true (if this was true, Tableau would not be in the leaders quadrant of Magic Quadrant for Business Intelligence and Analytics Platforms 2014).

Tableau offers tremendous efficiency, productivity, flexibility, performance and cost savings. Some discovers this accidentally, they bring Tableau in the project as their personal tool to understand data and then Tableau's highly viral nature carries it into the hearth of enterprise BI. Some innovative project teams head starts enterprise BI with Tableau and usually awarded successful implementations ("usually" because some teams will always have the ability to screw up projects even with great tools). You can see this in numbers. In Q2 2014, there were 157 $100,000-plus deals (a usual KPI to measure enterprise success of BI tools) and the number is increasing fast.

And yet the best part of the story is that Tableau Software, the company developing Tableau, is working hard to make it more enterprise ready in every release.

Tableau 9.0, the upcoming major version release, will most probably carry the product to a much higher level. September 2014's Tableau Customer Conference was the most important indicator of this ground breaking shift : "Tableau for Enterprise BI" was more emphasized compared to previous years. In an interview with InformationWeek, Tableau's VP product management Daniel Jewett, said that they have had a roadmap for how to bring 'analytics at scale' for five years. In the conference of September, Tableau Software also announced a massive update of its data engine that will bring support of parallel queries on machines with multicore processors, resulting in a 4x speed increase, company executives said.

Another gesture of focus for wide-scale enterprise deployments was the introduction of Tableau Drive, an implementation methodology and a set of services. Based on iterative, agile methods that are faster and more effective than traditional long-cycle deployments, Tableau Drive, is freely available.

Tableau is also commercially more effective compared to many competitors out there. Although Tableau server license pricing is not public, I would say it scales up very well without going into "Oh-my-Gosh" region in terms of Dollars.

Tuesday, October 21, 2014

QlikView Training in Singapore

QlikView is one of the most popular and powerful business intelligence platform in the market today. QlikView's distruptive technology makes it a key player in business intelligence industry. With its flexible and powerful analytics environment, building QlikView apps can be mastered by both developers and business users.

Qlik (the company behind QlikView) provides two basic courses for those who wish to learn QlikView : QlikView Designer Training courses for business users and QlikView Developer Training for advanced developers. QlikView Designer course is 2 days and QlikView Developer Training is 3 days. Those who wish to take 3 days developer training needs to take the 2 days designer training.

These two courses are what you can find when you take training from Qlik or some partners of Qlik. But there are alternatives. There is for example a QlikView 11 for Developers material, which covers a more hands-on approach then the standard training. In this course, some powerful and complex concepts are covered better. The material also covers the higher level concepts like how business dashboards should be organized.

With this hands-on QlikView training in Singapore, you can learn to create business intelligence
applications in QlikView platform.

In Singapore "QlikView 11 for Developers" based training is available. Throughout the training, attendees learn to build a QlikView application based on real data that will help a company to make informed decisions and analysis-guided strategies. The application will evolve from chapter to chapter along with the skills of participants, going from a simple proof-of-concept to creating a data model, adding custom styles, building a dashboard, and handling and manipulating the source data by the script.

If you are a developer who is looking for a fast and easy way to develop Business Intelligence applications with QlikView, this course is for you. If you are a power-user in QlikView environment, then you will also find tips and best practices to improve your QlikView skills.

These "QlikView 11 for Developers" courses are conducted in Singapore with QlikView experts (8 years plus experience in QlikView). For course schedule, and details like pricing please go to QlikView Training in Singapore.

Monday, October 20, 2014

Data Visualization for Shipping Industry

This powerful white boarding and demo of a Revenue and Profit Analysis of a shipping company is a rare gem which shows how a powerful data visualization plarform (Tableau in this case) can help companies to analyze their data and dig deep into "why"s.

The video is prepared by a Tableau customer in Indonesia, a leading Shipping and Shipyard Company named PT Usda Seroja Jaya, to introduce their new data visualization platform, Tableau, to their users.

The video starts with a white boarding presentation to illustrate how data analytics can help the company to improve decision making process. The second half of the video is a detailed Tableau demo, a rare data analytics demo for shipping industry. The Tableau demo is also a nice self-service BI presentation for this powerful application.

Tableau is business intelligence software that allows anyone to connect to data in a few clicks, then visualize and create interactive, sharable dashboards with a few more. It's easy enough that any Excel user can learn it, but powerful enough to satisfy even the most complex analytical problems. Securely sharing your findings with others only takes seconds.

Wednesday, October 15, 2014

KMS has been voted and endorsed as the 2014 Top vendor of BI Information Delivery & Analytics

Singapore, October 8th 2014 – Singapore based Business Intelligence Solutions Provider Knowledge Management Solutions Pte. Ltd. (KMS) has announced today that it has been voted and endorsed as the 2014 Top vendor of BI Information Delivery & Analytics by CXO Honour Singapore. Over 700 Chief Information Officers (CIOs) across Singapore were invited to take part in an unbiased online survey with CIOs naming their preferred Vendors in selected segments and categories over the full technology landscape.

The award came as Knowledge Management Solutions was preparing to celebrate its 10th year in Business Intelligence in December 2014. The company, which started as a vendor specific BI solution provider successfully turned itself into a BI Information Delivery and Analytics Solutions Provider in the previous years, offering a decade old experience in BI on some of the best platforms in the market today, QlikView, Tableau and Jedox.

KMS has received the award at by CXO Honour Singapore inaugural Red Carpet Honour 2014 Reception on Wednesday, October 8, 2014 at The St. Regis Singapore.


About Knowledge Management Solutions

Headquartered in Singapore and with offices in Kuala Lumpur, Bangkok and Indonesia, Knowledge Management Solutions (KMS) is one of Asia Pacific regions oldest and largest Business Intelligence and Analytics solutions provider. Incoorporated in 2004, KMS has served more than 400 customers in the region. The company provides business intelligence, data visualization and corporate performance management solution development on top of today’s best agile BI platforms : QlikView, Tableau and Jedox.

www.kms-world.com

About CXO Honour Singapore

CXO HONOUR is a platform that enables an inclusive local community of senior ICM industry leaders to have sustained engagements and partnerships. CXO HONOUR® is a very powerful platform for vendors in the Infocomm & Media (ICM) sector to promote and market their products, services and solutions to the C-level suite (CXO) within the enterprises. 

Wednesday, October 8, 2014

Tableau, Qlikview, TIBCO, SAS, and Oracle gets best business intelligence ratings

Tableau Desktop has been rated as the best business intelligence platform by business software reviews site G2 Crowd users.  Tableau, the long time category winner, was followed by QlikView, TIBCO Spotfire, SAS BI and Oracle BI.

The Grid for Business Intelligence by G2 Crowd rates and profiles business intelligence products. Products shown on the Grid for Business Intelligence have received a minimum of 10 reviews in data gathered by September 19th, 2014. Products are ranked by customer satisfaction (based on user reviews) and market presence (based on market share, vendor size, and social impact) and placed into four categories on the Grid : Leaders, Contenders, Niche and High Performers.

Leaders offer Business Intelligence products that are rated highly by G2 Crowd users and have substantial scale, market share, and global support and service resources. According to G2 Crowd Grid for Business Intelligence, Tableau Desktop, QlikView, TIBCO Sportfire, SAS BI and Oracle BI were leaders in business intelligence domain.

Tableau Desktop received 42 reviews and satisfaction was 99 percent! With market presence score of 61, Tableau overall got a scoring of 80. The second leader, QlikView got 24 reviews and the satisfaction was scores as 85. With market presence score of 54, QlikView got a score of 69. Oracle BI got the highest market presence score but lowest satisfaction in the list.

Other high ranking BI platforms are in contenders category : Business Objects, MicroStrategy, Hyperion. IBM Cognos and TIBCO Jaspersoft.

Birst and Pentaho are listed in Niche category and GoodData BI and Alteryx were High Performers.

G2 Crowd Grid for Business Intelligence Fall 2014
 You can see the details here at Compare Best Business Intelligence Software.

G2 Crowd defines Business Intelligence software as a solution that helps companies gain perspective on their business operations by leveraging data from any internal sources that detail business activity and its results (financial, marketing, operations, etc). The term business intelligence according to G2 Crowd encompasses the process of transforming unstructured business data into standardized reportable datasets and visualizing that into graphs and tables that expose valuable insights into ROI and process best practices. This software often creates automated reports and dashboards that can be deployed to end users, as well as non-technical user interfaces for business users to slice and dice data on their own and preform ad hoc reporting. 

Friday, October 3, 2014

Asset Management Dashboard Demo by QlikView Business Intelligence Platform

Asset Under Management analysis is an important part of any financial institution in asset management, private banking and wealth management business. The data can be quite huge and data from many different sources need to be combined to get the big picture. Unfortunately, this process is quite manual in many organizations where plain old MS Excel is used  to perform analysis with usually poor results.

We have seen that a powerful business intelligence platform can be leveraged for wealth management, asset management and private banking institutions to increase analyis productivity greatly. But what is developed is usually not public (even dashboard layouts are protected) so you can not see a lot of nice asset management business intelligence dashboards.

This rare Asset Management demo provides an analysis of assets under management by various dimensions such as asset class, investor, fund type and region. Users can look up funds and their performance and analyze fund details. The source data are from multiple systems such as AUM, Positions, Risk, Returns, Traiding, Portfolio etc. It also contains a capability to look up a group of CUSIPs on finger tips.

The demo application is developed on powerful QlikView Business Intelligence platform which is heavily used in many finance and banking companies.

The Asset Management application contains an Asset Under Management Dashboard to analyze Overall AUM summary by asset class, investor, fund type, as well as region, Investment Profile View, Trades and Positions Analysis View, Investment Screener View (Multiple fund performance and assets under management summary) and Fund Details view where users can access to an Excel-like pivot table ad-hoc analysis of fund details.

In Investment Profile view, when you select a specific fund, you can print the report in PDF with a simple button click.
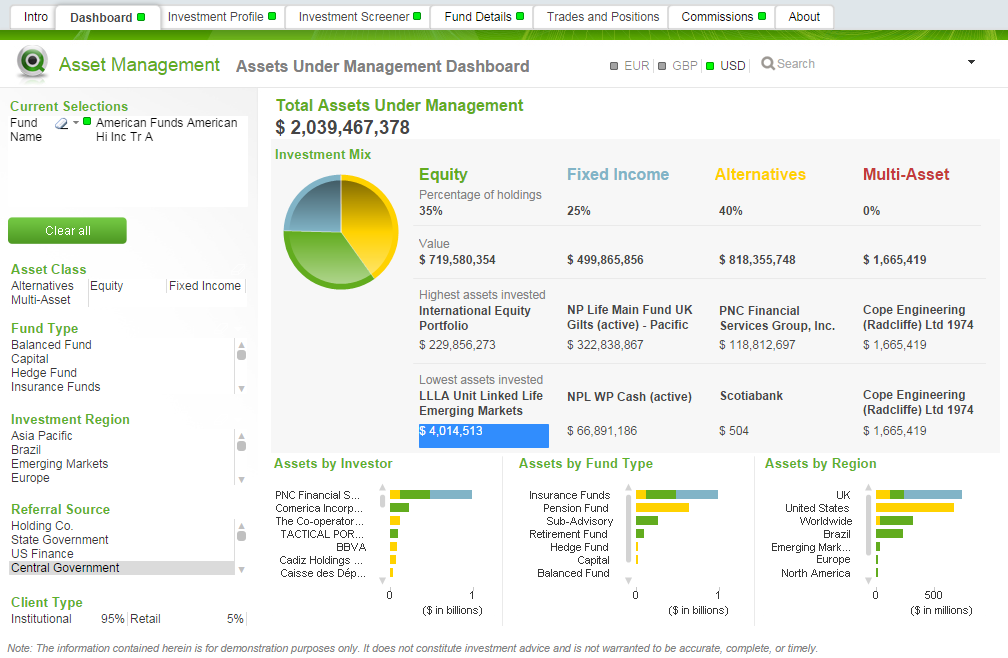
Asset Under Management Dashboard
Asset Under Management Dashboard Demo

Free access to QlikView Asset Management Dashboard

You can try Asset Management Dashboard demo by accessing the free public demo application. Fill in your name, e-mail and phone to the below form and press submit button. You will receive an e-mail links to web based dashboard (you can also access through mobile devices), a self-executable file for you to try it locally (no QlikView license required) and supporting material such as demo video.

Please fill in Data Analytics with Qlik Demo/App Request Formform (select "Asset Management Dashboard Demo by QlikView Business Intelligence Platform" in dropdown).

Retailer POS Data Analysis Dashboard by QlikView Business Intelligence Platform

Retailer POS Data Analysis Dashboard demo is designed to give visibility into the Retail environment for Consumer Products companies. The source of data is the Retailer who makes information available from their store EPOS and depot systems to the Consumer Goods company.

This demo gives any retailers a picture of product stock levels in store, depot and in transit, as well as sales analysis. The app supports you in you efforts to deliver improved product availability through allowing your organization to reduce out-of-stocks and lost sales potential, as well as identifying potential alternative sources of replenishment.

The POS Data Analysis is developed on powerful QlikView Business Intelligence platform and utilizes its associative features as well as state-of-the-art GUI. Over 3,000 Retail and Wholesale
Distribution companies globally rely on QlikView to empower business users and decision-makers today, by providing access to on-demand analysis, insights and business discovery.

The application contains several views : Dashboard, Item Analysis, Store and Depot Analysis, Growth Analysis, Days on Hand Analysis, Distribution Analysis and Item Store Mix Analysis.

Below, there are some screenshots from the dashboard application. Below the screenshots you can access the demo package composed of link to online Retailer EPOS Data Analysis application, a self-executable version of the same application and a video demo.

QlikView Retailer POS Data Analysis Dashboard View
Retailer POS Data Analysis Dashboard View


Retailer POS Data Analysis Store and Depot View has Google maps integration
Free access to QlikView Retailer POS Data Analysis Dashboard

You can try Retailer POS Data Analysis demo by accessing the free public demo application. Fill in your name, e-mail and phone to the below form and press submit button. You will receive an e-mail links to web based dashboard (you can also access through mobile devices), a self-executable file for you to try it locally (no QlikView license required) and supporting material such as demo video.


Get Acess to Free Copy of Retailer EPOS Data Analysis Dashboard
Name :
E-mail :
Phone :